Marshallese vs Immigrants from Indonesia Single Father Households
COMPARE
Marshallese
Immigrants from Indonesia
Single Father Households
Single Father Households Comparison
Marshallese
Immigrants from Indonesia
2.4%
SINGLE FATHER HOUSEHOLDS
9.7/ 100
METRIC RATING
225th/ 347
METRIC RANK
2.2%
SINGLE FATHER HOUSEHOLDS
97.4/ 100
METRIC RATING
125th/ 347
METRIC RANK
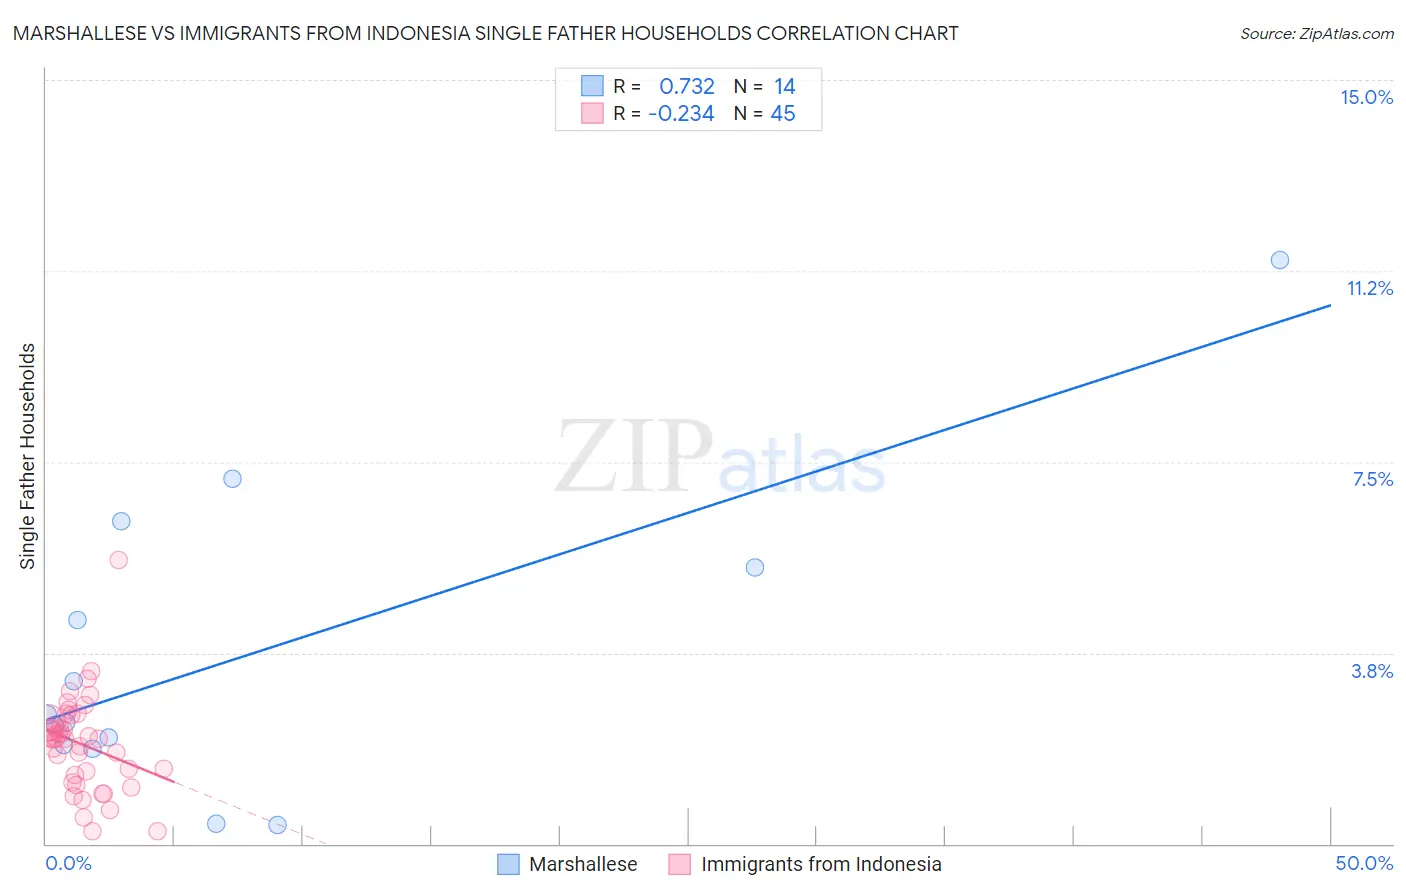
Marshallese vs Immigrants from Indonesia Single Father Households Correlation Chart
The statistical analysis conducted on geographies consisting of 14,759,622 people shows a strong positive correlation between the proportion of Marshallese and percentage of single father households in the United States with a correlation coefficient (R) of 0.732 and weighted average of 2.4%. Similarly, the statistical analysis conducted on geographies consisting of 214,943,478 people shows a weak negative correlation between the proportion of Immigrants from Indonesia and percentage of single father households in the United States with a correlation coefficient (R) of -0.234 and weighted average of 2.2%, a difference of 11.5%.
Single Father Households Correlation Summary
| Measurement | Marshallese | Immigrants from Indonesia |
| Minimum | 0.37% | 0.25% |
| Maximum | 11.5% | 5.6% |
| Range | 11.1% | 5.3% |
| Mean | 3.7% | 2.0% |
| Median | 2.5% | 2.1% |
| Interquartile 25% (IQ1) | 1.9% | 1.3% |
| Interquartile 75% (IQ3) | 5.4% | 2.5% |
| Interquartile Range (IQR) | 3.5% | 1.2% |
| Standard Deviation (Sample) | 3.0% | 0.94% |
| Standard Deviation (Population) | 2.9% | 0.93% |
Similar Demographics by Single Father Households
Demographics Similar to Marshallese by Single Father Households
In terms of single father households, the demographic groups most similar to Marshallese are Black/African American (2.4%, a difference of 0.010%), American (2.4%, a difference of 0.080%), Immigrants from Ghana (2.4%, a difference of 0.12%), Immigrants from Bahamas (2.4%, a difference of 0.17%), and Immigrants from Zaire (2.4%, a difference of 0.23%).
| Demographics | Rating | Rank | Single Father Households |
| Immigrants | Ethiopia | 13.4 /100 | #218 | Poor 2.4% |
| Sudanese | 13.0 /100 | #219 | Poor 2.4% |
| Ghanaians | 12.9 /100 | #220 | Poor 2.4% |
| Immigrants | Burma/Myanmar | 12.1 /100 | #221 | Poor 2.4% |
| Immigrants | Eastern Africa | 11.9 /100 | #222 | Poor 2.4% |
| Immigrants | Uruguay | 11.0 /100 | #223 | Poor 2.4% |
| Immigrants | Bahamas | 10.6 /100 | #224 | Poor 2.4% |
| Marshallese | 9.7 /100 | #225 | Tragic 2.4% |
| Blacks/African Americans | 9.7 /100 | #226 | Tragic 2.4% |
| Americans | 9.3 /100 | #227 | Tragic 2.4% |
| Immigrants | Ghana | 9.1 /100 | #228 | Tragic 2.4% |
| Immigrants | Zaire | 8.6 /100 | #229 | Tragic 2.4% |
| Sub-Saharan Africans | 8.3 /100 | #230 | Tragic 2.4% |
| Immigrants | Nonimmigrants | 7.6 /100 | #231 | Tragic 2.4% |
| Pennsylvania Germans | 7.3 /100 | #232 | Tragic 2.4% |
Demographics Similar to Immigrants from Indonesia by Single Father Households
In terms of single father households, the demographic groups most similar to Immigrants from Indonesia are British West Indian (2.2%, a difference of 0.050%), Immigrants from Yemen (2.2%, a difference of 0.070%), Immigrants from Iraq (2.2%, a difference of 0.22%), Moroccan (2.2%, a difference of 0.31%), and Jordanian (2.2%, a difference of 0.31%).
| Demographics | Rating | Rank | Single Father Households |
| Immigrants | Morocco | 97.8 /100 | #118 | Exceptional 2.2% |
| Trinidadians and Tobagonians | 97.8 /100 | #119 | Exceptional 2.2% |
| Australians | 97.7 /100 | #120 | Exceptional 2.2% |
| Immigrants | Brazil | 97.7 /100 | #121 | Exceptional 2.2% |
| Immigrants | Iraq | 97.6 /100 | #122 | Exceptional 2.2% |
| Immigrants | Yemen | 97.5 /100 | #123 | Exceptional 2.2% |
| British West Indians | 97.4 /100 | #124 | Exceptional 2.2% |
| Immigrants | Indonesia | 97.4 /100 | #125 | Exceptional 2.2% |
| Moroccans | 96.9 /100 | #126 | Exceptional 2.2% |
| Jordanians | 96.9 /100 | #127 | Exceptional 2.2% |
| Immigrants | England | 96.8 /100 | #128 | Exceptional 2.2% |
| Serbians | 96.8 /100 | #129 | Exceptional 2.2% |
| Immigrants | Chile | 96.7 /100 | #130 | Exceptional 2.2% |
| Immigrants | Jordan | 96.6 /100 | #131 | Exceptional 2.2% |
| Poles | 96.5 /100 | #132 | Exceptional 2.2% |