Marshallese vs Native/Alaskan Disability Age 35 to 64
COMPARE
Marshallese
Native/Alaskan
Disability Age 35 to 64
Disability Age 35 to 64 Comparison
Marshallese
Natives/Alaskans
12.5%
DISABILITY AGE 35 TO 64
0.4/ 100
METRIC RATING
265th/ 347
METRIC RANK
15.3%
DISABILITY AGE 35 TO 64
0.0/ 100
METRIC RATING
326th/ 347
METRIC RANK
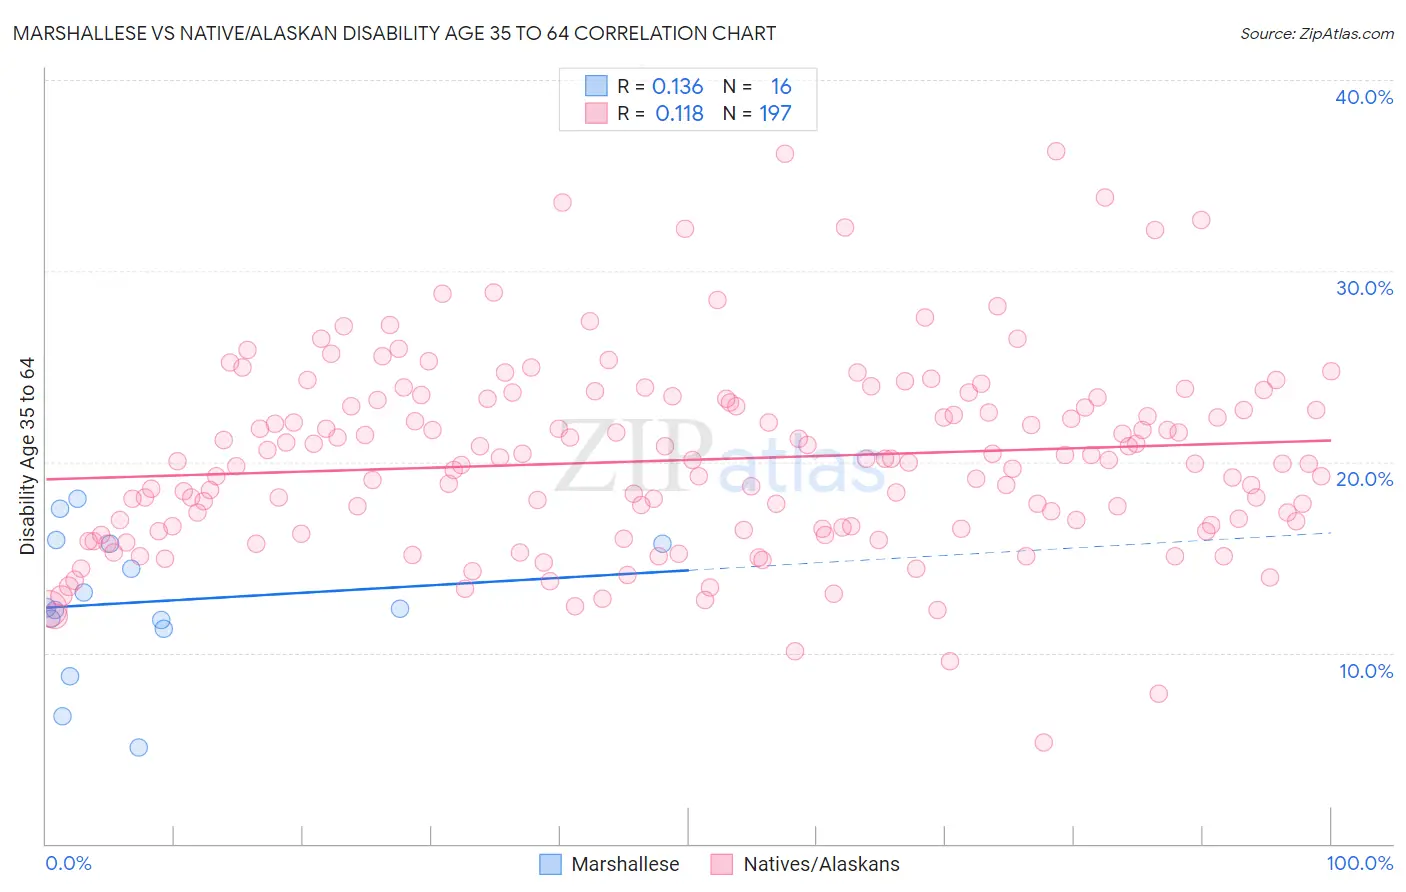
Marshallese vs Native/Alaskan Disability Age 35 to 64 Correlation Chart
The statistical analysis conducted on geographies consisting of 14,761,315 people shows a poor positive correlation between the proportion of Marshallese and percentage of population with a disability between the ages 34 and 64 in the United States with a correlation coefficient (R) of 0.136 and weighted average of 12.5%. Similarly, the statistical analysis conducted on geographies consisting of 512,516,181 people shows a poor positive correlation between the proportion of Natives/Alaskans and percentage of population with a disability between the ages 34 and 64 in the United States with a correlation coefficient (R) of 0.118 and weighted average of 15.3%, a difference of 22.1%.
Disability Age 35 to 64 Correlation Summary
| Measurement | Marshallese | Native/Alaskan |
| Minimum | 5.1% | 5.3% |
| Maximum | 18.1% | 36.2% |
| Range | 13.0% | 31.0% |
| Mean | 12.7% | 20.1% |
| Median | 12.3% | 20.0% |
| Interquartile 25% (IQ1) | 11.5% | 16.5% |
| Interquartile 75% (IQ3) | 15.7% | 23.2% |
| Interquartile Range (IQR) | 4.3% | 6.7% |
| Standard Deviation (Sample) | 3.6% | 5.0% |
| Standard Deviation (Population) | 3.5% | 5.0% |
Similar Demographics by Disability Age 35 to 64
Demographics Similar to Marshallese by Disability Age 35 to 64
In terms of disability age 35 to 64, the demographic groups most similar to Marshallese are Immigrants from Portugal (12.5%, a difference of 0.11%), Immigrants from Zaire (12.5%, a difference of 0.12%), Senegalese (12.5%, a difference of 0.37%), Malaysian (12.5%, a difference of 0.45%), and German Russian (12.5%, a difference of 0.60%).
| Demographics | Rating | Rank | Disability Age 35 to 64 |
| Welsh | 0.6 /100 | #258 | Tragic 12.4% |
| English | 0.6 /100 | #259 | Tragic 12.4% |
| German Russians | 0.5 /100 | #260 | Tragic 12.5% |
| Malaysians | 0.5 /100 | #261 | Tragic 12.5% |
| Senegalese | 0.5 /100 | #262 | Tragic 12.5% |
| Immigrants | Zaire | 0.4 /100 | #263 | Tragic 12.5% |
| Immigrants | Portugal | 0.4 /100 | #264 | Tragic 12.5% |
| Marshallese | 0.4 /100 | #265 | Tragic 12.5% |
| Whites/Caucasians | 0.3 /100 | #266 | Tragic 12.6% |
| Sub-Saharan Africans | 0.2 /100 | #267 | Tragic 12.6% |
| Immigrants | Dominica | 0.2 /100 | #268 | Tragic 12.7% |
| Spanish | 0.2 /100 | #269 | Tragic 12.7% |
| French | 0.2 /100 | #270 | Tragic 12.7% |
| Nepalese | 0.1 /100 | #271 | Tragic 12.8% |
| U.S. Virgin Islanders | 0.1 /100 | #272 | Tragic 12.8% |
Demographics Similar to Natives/Alaskans by Disability Age 35 to 64
In terms of disability age 35 to 64, the demographic groups most similar to Natives/Alaskans are Pueblo (15.3%, a difference of 0.020%), Cajun (15.3%, a difference of 0.20%), Cherokee (15.5%, a difference of 0.95%), Navajo (15.5%, a difference of 1.2%), and Arapaho (15.1%, a difference of 1.6%).
| Demographics | Rating | Rank | Disability Age 35 to 64 |
| Immigrants | Cabo Verde | 0.0 /100 | #319 | Tragic 14.7% |
| Blacks/African Americans | 0.0 /100 | #320 | Tragic 14.7% |
| Comanche | 0.0 /100 | #321 | Tragic 14.7% |
| Potawatomi | 0.0 /100 | #322 | Tragic 14.8% |
| Apache | 0.0 /100 | #323 | Tragic 14.9% |
| Chippewa | 0.0 /100 | #324 | Tragic 15.0% |
| Arapaho | 0.0 /100 | #325 | Tragic 15.1% |
| Natives/Alaskans | 0.0 /100 | #326 | Tragic 15.3% |
| Pueblo | 0.0 /100 | #327 | Tragic 15.3% |
| Cajuns | 0.0 /100 | #328 | Tragic 15.3% |
| Cherokee | 0.0 /100 | #329 | Tragic 15.5% |
| Navajo | 0.0 /100 | #330 | Tragic 15.5% |
| Dutch West Indians | 0.0 /100 | #331 | Tragic 15.6% |
| Alaskan Athabascans | 0.0 /100 | #332 | Tragic 15.7% |
| Yuman | 0.0 /100 | #333 | Tragic 15.8% |