Marshallese vs Immigrants from Lithuania No Vehicles in Household
COMPARE
Marshallese
Immigrants from Lithuania
No Vehicles in Household
No Vehicles in Household Comparison
Marshallese
Immigrants from Lithuania
9.8%
NO VEHICLES IN HOUSEHOLD
84.0/ 100
METRIC RATING
139th/ 347
METRIC RANK
9.8%
NO VEHICLES IN HOUSEHOLD
84.0/ 100
METRIC RATING
140th/ 347
METRIC RANK
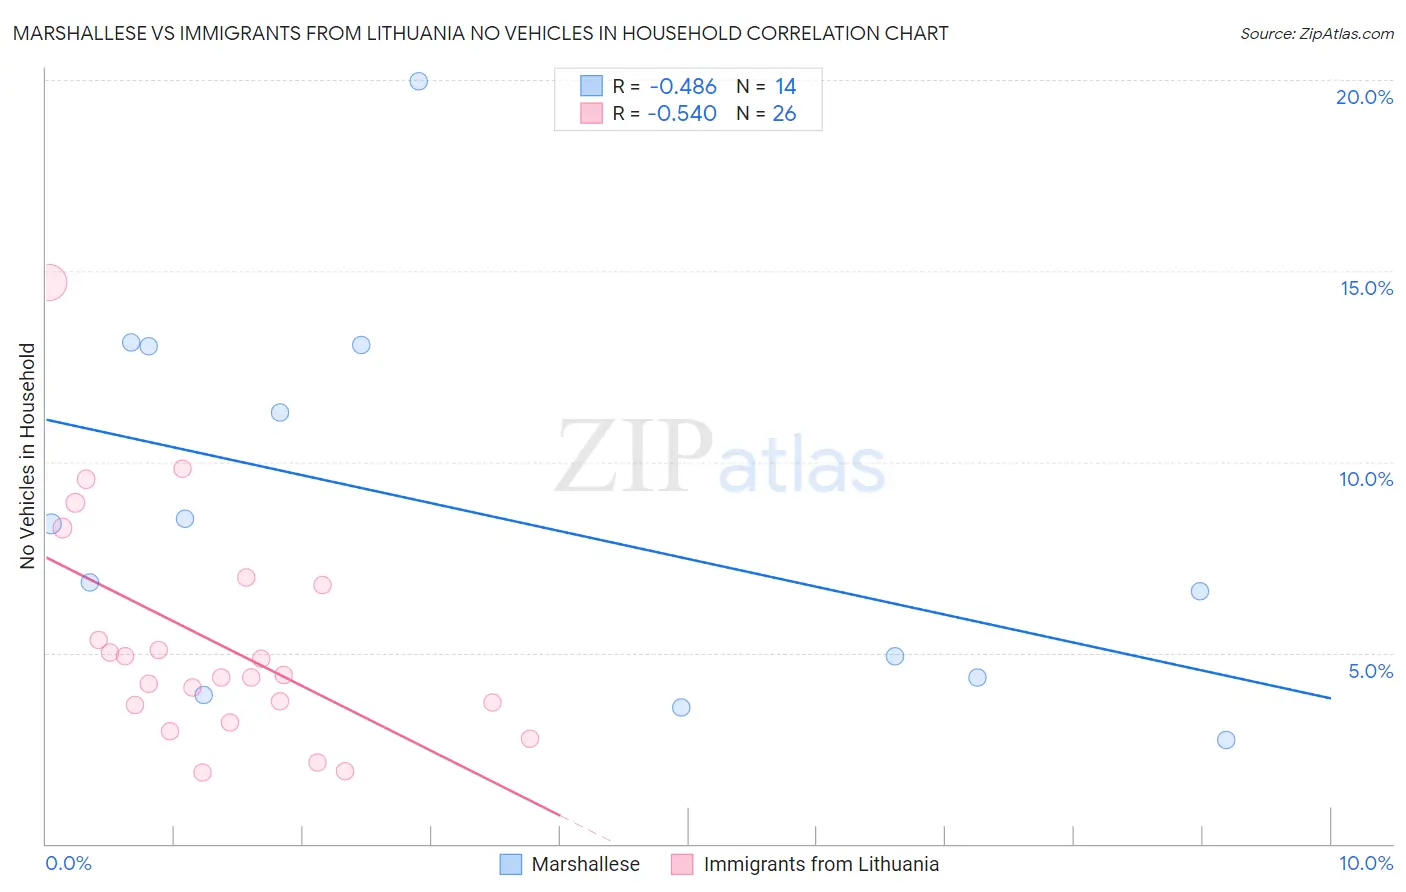
Marshallese vs Immigrants from Lithuania No Vehicles in Household Correlation Chart
The statistical analysis conducted on geographies consisting of 14,756,387 people shows a moderate negative correlation between the proportion of Marshallese and percentage of households with no vehicle available in the United States with a correlation coefficient (R) of -0.486 and weighted average of 9.8%. Similarly, the statistical analysis conducted on geographies consisting of 117,637,222 people shows a substantial negative correlation between the proportion of Immigrants from Lithuania and percentage of households with no vehicle available in the United States with a correlation coefficient (R) of -0.540 and weighted average of 9.8%, a difference of 0.010%.
No Vehicles in Household Correlation Summary
| Measurement | Marshallese | Immigrants from Lithuania |
| Minimum | 2.7% | 1.9% |
| Maximum | 20.0% | 14.7% |
| Range | 17.3% | 12.8% |
| Mean | 8.6% | 5.3% |
| Median | 7.6% | 4.4% |
| Interquartile 25% (IQ1) | 4.3% | 3.6% |
| Interquartile 75% (IQ3) | 13.0% | 6.8% |
| Interquartile Range (IQR) | 8.7% | 3.1% |
| Standard Deviation (Sample) | 4.9% | 2.9% |
| Standard Deviation (Population) | 4.8% | 2.9% |
Demographics Similar to Marshallese and Immigrants from Lithuania by No Vehicles in Household
In terms of no vehicles in household, the demographic groups most similar to Marshallese are Estonian (9.8%, a difference of 0.050%), Immigrants from Moldova (9.8%, a difference of 0.16%), Sudanese (9.8%, a difference of 0.23%), Immigrants from South Africa (9.8%, a difference of 0.26%), and Latvian (9.8%, a difference of 0.31%). Similarly, the demographic groups most similar to Immigrants from Lithuania are Estonian (9.8%, a difference of 0.060%), Immigrants from Moldova (9.8%, a difference of 0.17%), Sudanese (9.8%, a difference of 0.22%), Immigrants from South Africa (9.8%, a difference of 0.27%), and Latvian (9.8%, a difference of 0.32%).
| Demographics | Rating | Rank | No Vehicles in Household |
| Nicaraguans | 89.5 /100 | #129 | Excellent 9.7% |
| Burmese | 88.8 /100 | #130 | Excellent 9.7% |
| Immigrants | Azores | 88.2 /100 | #131 | Excellent 9.7% |
| Kenyans | 88.0 /100 | #132 | Excellent 9.7% |
| Immigrants | Oceania | 87.1 /100 | #133 | Excellent 9.7% |
| Syrians | 87.1 /100 | #134 | Excellent 9.7% |
| Latvians | 85.1 /100 | #135 | Excellent 9.8% |
| Immigrants | South Africa | 85.0 /100 | #136 | Excellent 9.8% |
| Immigrants | Moldova | 84.6 /100 | #137 | Excellent 9.8% |
| Estonians | 84.2 /100 | #138 | Excellent 9.8% |
| Marshallese | 84.0 /100 | #139 | Excellent 9.8% |
| Immigrants | Lithuania | 84.0 /100 | #140 | Excellent 9.8% |
| Sudanese | 83.1 /100 | #141 | Excellent 9.8% |
| Immigrants | Zimbabwe | 82.6 /100 | #142 | Excellent 9.9% |
| Chileans | 81.2 /100 | #143 | Excellent 9.9% |
| Immigrants | Bahamas | 81.2 /100 | #144 | Excellent 9.9% |
| Bahamians | 81.0 /100 | #145 | Excellent 9.9% |
| Hungarians | 80.0 /100 | #146 | Excellent 9.9% |
| Immigrants | Nicaragua | 79.8 /100 | #147 | Good 9.9% |
| Immigrants | Bosnia and Herzegovina | 79.1 /100 | #148 | Good 9.9% |
| Immigrants | Uganda | 76.1 /100 | #149 | Good 10.0% |