Immigrants from Congo vs Barbadian Married-couple Households
COMPARE
Immigrants from Congo
Barbadian
Married-couple Households
Married-couple Households Comparison
Immigrants from Congo
Barbadians
39.0%
MARRIED-COUPLE HOUSEHOLDS
0.0/ 100
METRIC RATING
331st/ 347
METRIC RANK
39.4%
MARRIED-COUPLE HOUSEHOLDS
0.0/ 100
METRIC RATING
328th/ 347
METRIC RANK
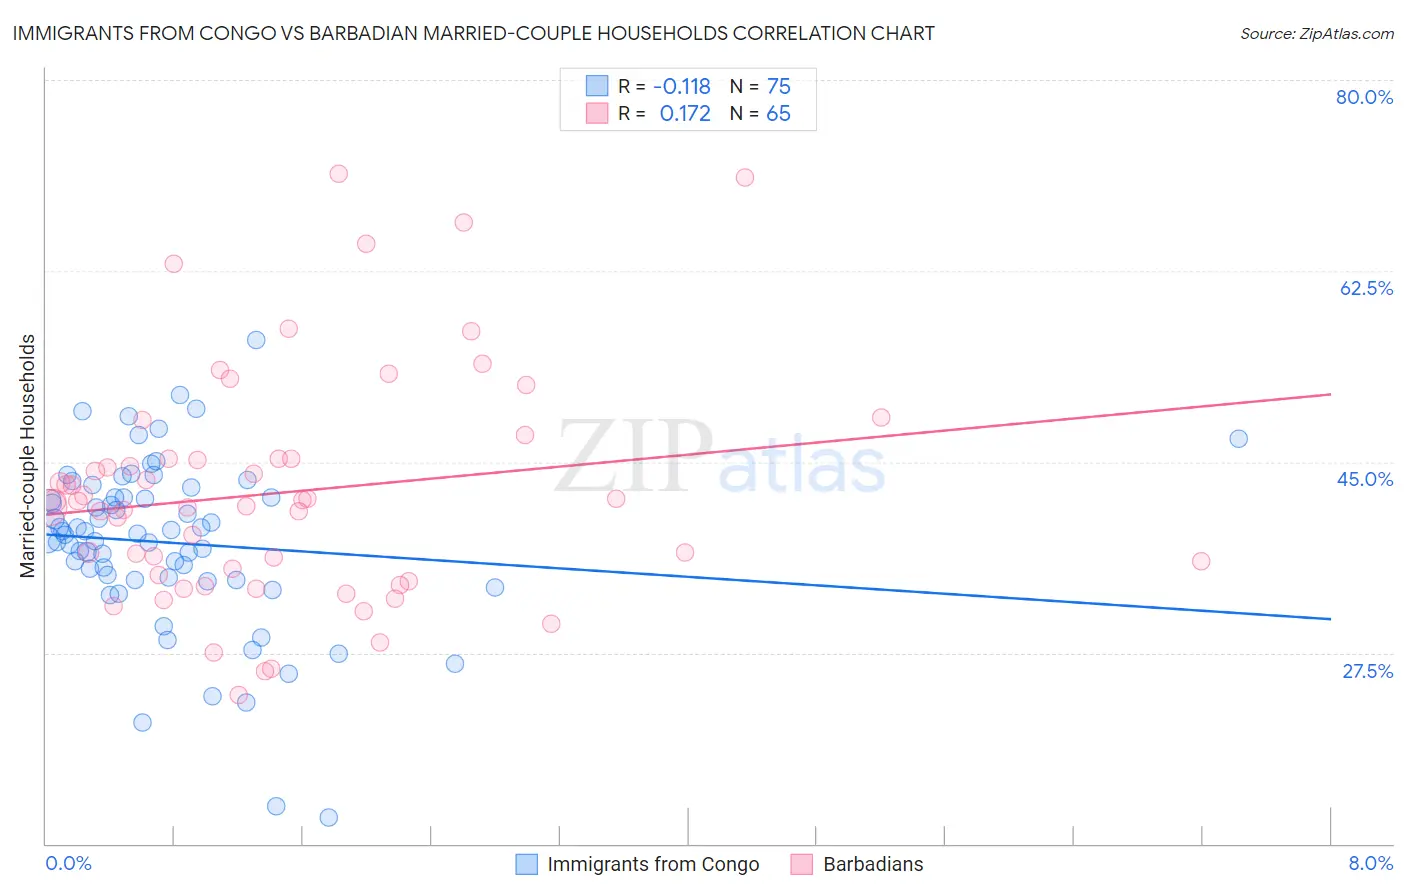
Immigrants from Congo vs Barbadian Married-couple Households Correlation Chart
The statistical analysis conducted on geographies consisting of 92,079,581 people shows a poor negative correlation between the proportion of Immigrants from Congo and percentage of married-couple family households in the United States with a correlation coefficient (R) of -0.118 and weighted average of 39.0%. Similarly, the statistical analysis conducted on geographies consisting of 141,274,787 people shows a poor positive correlation between the proportion of Barbadians and percentage of married-couple family households in the United States with a correlation coefficient (R) of 0.172 and weighted average of 39.4%, a difference of 0.95%.
Married-couple Households Correlation Summary
| Measurement | Immigrants from Congo | Barbadian |
| Minimum | 12.4% | 23.7% |
| Maximum | 56.2% | 71.4% |
| Range | 43.8% | 47.7% |
| Mean | 37.6% | 42.2% |
| Median | 38.4% | 41.4% |
| Interquartile 25% (IQ1) | 34.2% | 34.4% |
| Interquartile 75% (IQ3) | 41.7% | 45.3% |
| Interquartile Range (IQR) | 7.5% | 10.9% |
| Standard Deviation (Sample) | 7.8% | 10.5% |
| Standard Deviation (Population) | 7.8% | 10.5% |
Demographics Similar to Immigrants from Congo and Barbadians by Married-couple Households
In terms of married-couple households, the demographic groups most similar to Immigrants from Congo are Somali (39.0%, a difference of 0.090%), Immigrants from West Indies (39.0%, a difference of 0.12%), Immigrants from Barbados (39.2%, a difference of 0.44%), Immigrants from Dominica (39.4%, a difference of 0.88%), and Immigrants from St. Vincent and the Grenadines (38.7%, a difference of 0.90%). Similarly, the demographic groups most similar to Barbadians are Immigrants from Dominica (39.4%, a difference of 0.080%), Lumbee (39.6%, a difference of 0.50%), Immigrants from Barbados (39.2%, a difference of 0.52%), U.S. Virgin Islander (39.8%, a difference of 0.97%), and Somali (39.0%, a difference of 1.0%).
| Demographics | Rating | Rank | Married-couple Households |
| Bahamians | 0.0 /100 | #319 | Tragic 40.5% |
| West Indians | 0.0 /100 | #320 | Tragic 40.3% |
| Immigrants | Liberia | 0.0 /100 | #321 | Tragic 40.3% |
| Immigrants | Zaire | 0.0 /100 | #322 | Tragic 40.1% |
| Puerto Ricans | 0.0 /100 | #323 | Tragic 40.1% |
| Navajo | 0.0 /100 | #324 | Tragic 40.1% |
| Pueblo | 0.0 /100 | #325 | Tragic 40.0% |
| U.S. Virgin Islanders | 0.0 /100 | #326 | Tragic 39.8% |
| Lumbee | 0.0 /100 | #327 | Tragic 39.6% |
| Barbadians | 0.0 /100 | #328 | Tragic 39.4% |
| Immigrants | Dominica | 0.0 /100 | #329 | Tragic 39.4% |
| Immigrants | Barbados | 0.0 /100 | #330 | Tragic 39.2% |
| Immigrants | Congo | 0.0 /100 | #331 | Tragic 39.0% |
| Somalis | 0.0 /100 | #332 | Tragic 39.0% |
| Immigrants | West Indies | 0.0 /100 | #333 | Tragic 39.0% |
| Immigrants | St. Vincent and the Grenadines | 0.0 /100 | #334 | Tragic 38.7% |
| Senegalese | 0.0 /100 | #335 | Tragic 38.6% |
| Blacks/African Americans | 0.0 /100 | #336 | Tragic 38.5% |
| Immigrants | Somalia | 0.0 /100 | #337 | Tragic 38.4% |
| Immigrants | Senegal | 0.0 /100 | #338 | Tragic 38.4% |
| British West Indians | 0.0 /100 | #339 | Tragic 38.3% |