Immigrants from Czechoslovakia vs Barbadian Married-couple Households
COMPARE
Immigrants from Czechoslovakia
Barbadian
Married-couple Households
Married-couple Households Comparison
Immigrants from Czechoslovakia
Barbadians
47.8%
MARRIED-COUPLE HOUSEHOLDS
95.5/ 100
METRIC RATING
105th/ 347
METRIC RANK
39.4%
MARRIED-COUPLE HOUSEHOLDS
0.0/ 100
METRIC RATING
328th/ 347
METRIC RANK
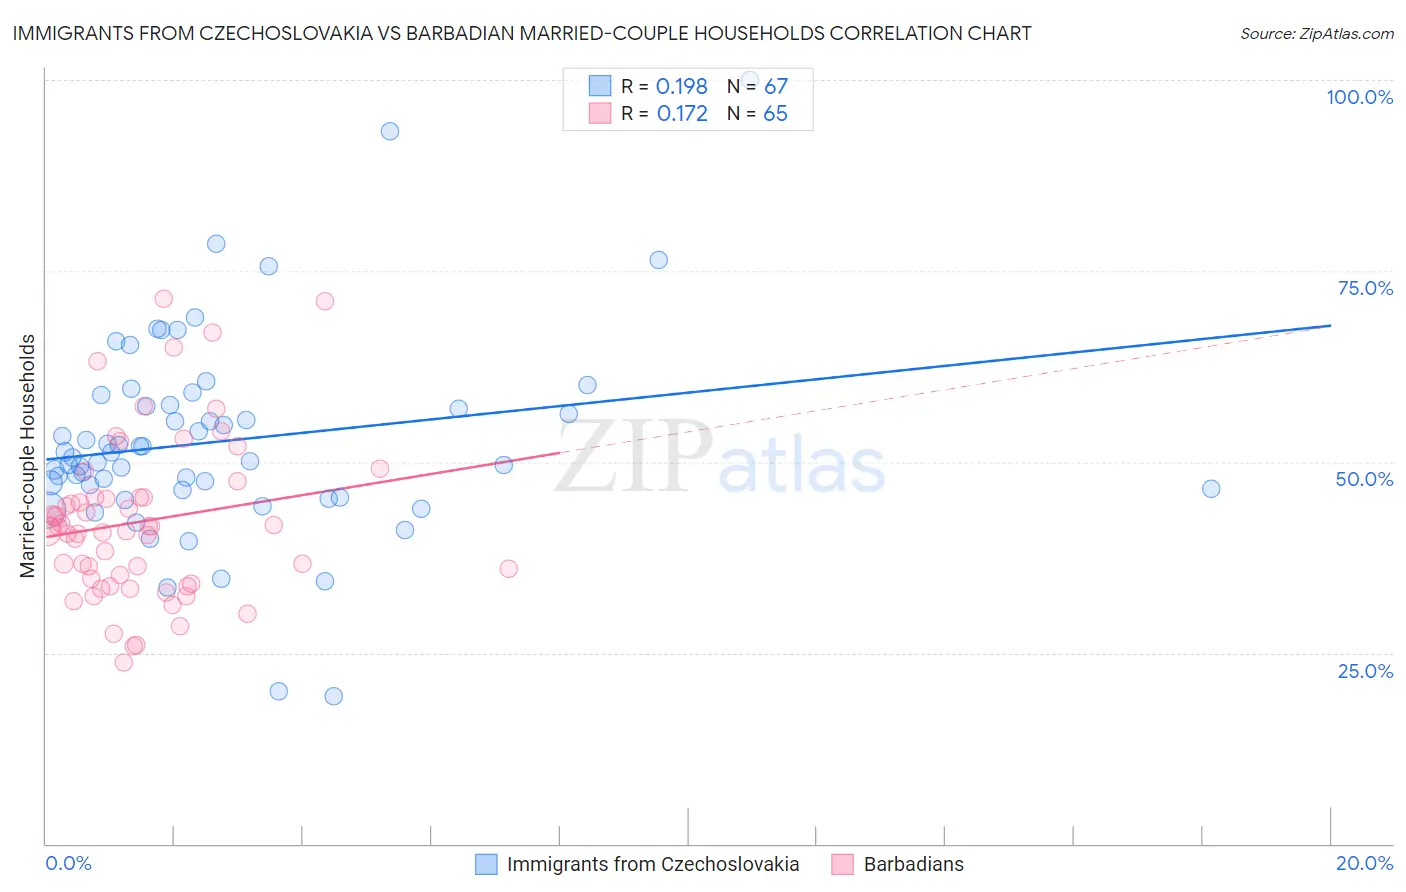
Immigrants from Czechoslovakia vs Barbadian Married-couple Households Correlation Chart
The statistical analysis conducted on geographies consisting of 195,446,712 people shows a poor positive correlation between the proportion of Immigrants from Czechoslovakia and percentage of married-couple family households in the United States with a correlation coefficient (R) of 0.198 and weighted average of 47.8%. Similarly, the statistical analysis conducted on geographies consisting of 141,274,787 people shows a poor positive correlation between the proportion of Barbadians and percentage of married-couple family households in the United States with a correlation coefficient (R) of 0.172 and weighted average of 39.4%, a difference of 21.3%.
Married-couple Households Correlation Summary
| Measurement | Immigrants from Czechoslovakia | Barbadian |
| Minimum | 19.3% | 23.7% |
| Maximum | 100.0% | 71.4% |
| Range | 80.7% | 47.7% |
| Mean | 52.7% | 42.2% |
| Median | 50.6% | 41.4% |
| Interquartile 25% (IQ1) | 46.3% | 34.4% |
| Interquartile 75% (IQ3) | 57.4% | 45.3% |
| Interquartile Range (IQR) | 11.1% | 10.9% |
| Standard Deviation (Sample) | 13.4% | 10.5% |
| Standard Deviation (Population) | 13.3% | 10.5% |
Similar Demographics by Married-couple Households
Demographics Similar to Immigrants from Czechoslovakia by Married-couple Households
In terms of married-couple households, the demographic groups most similar to Immigrants from Czechoslovakia are Portuguese (47.8%, a difference of 0.010%), Immigrants from South Africa (47.8%, a difference of 0.10%), Slavic (47.8%, a difference of 0.11%), Hawaiian (47.8%, a difference of 0.11%), and Turkish (47.8%, a difference of 0.13%).
| Demographics | Rating | Rank | Married-couple Households |
| Immigrants | North Macedonia | 96.4 /100 | #98 | Exceptional 47.9% |
| Immigrants | Austria | 96.4 /100 | #99 | Exceptional 47.9% |
| Immigrants | Italy | 96.3 /100 | #100 | Exceptional 47.9% |
| Turks | 96.1 /100 | #101 | Exceptional 47.8% |
| Slavs | 96.0 /100 | #102 | Exceptional 47.8% |
| Hawaiians | 96.0 /100 | #103 | Exceptional 47.8% |
| Immigrants | South Africa | 96.0 /100 | #104 | Exceptional 47.8% |
| Immigrants | Czechoslovakia | 95.5 /100 | #105 | Exceptional 47.8% |
| Portuguese | 95.5 /100 | #106 | Exceptional 47.8% |
| Estonians | 94.7 /100 | #107 | Exceptional 47.7% |
| Immigrants | Japan | 94.4 /100 | #108 | Exceptional 47.7% |
| Immigrants | Jordan | 94.1 /100 | #109 | Exceptional 47.7% |
| Macedonians | 93.9 /100 | #110 | Exceptional 47.6% |
| Syrians | 93.9 /100 | #111 | Exceptional 47.6% |
| Peruvians | 93.8 /100 | #112 | Exceptional 47.6% |
Demographics Similar to Barbadians by Married-couple Households
In terms of married-couple households, the demographic groups most similar to Barbadians are Immigrants from Dominica (39.4%, a difference of 0.080%), Lumbee (39.6%, a difference of 0.50%), Immigrants from Barbados (39.2%, a difference of 0.52%), Immigrants from Congo (39.0%, a difference of 0.95%), and U.S. Virgin Islander (39.8%, a difference of 0.97%).
| Demographics | Rating | Rank | Married-couple Households |
| Immigrants | Liberia | 0.0 /100 | #321 | Tragic 40.3% |
| Immigrants | Zaire | 0.0 /100 | #322 | Tragic 40.1% |
| Puerto Ricans | 0.0 /100 | #323 | Tragic 40.1% |
| Navajo | 0.0 /100 | #324 | Tragic 40.1% |
| Pueblo | 0.0 /100 | #325 | Tragic 40.0% |
| U.S. Virgin Islanders | 0.0 /100 | #326 | Tragic 39.8% |
| Lumbee | 0.0 /100 | #327 | Tragic 39.6% |
| Barbadians | 0.0 /100 | #328 | Tragic 39.4% |
| Immigrants | Dominica | 0.0 /100 | #329 | Tragic 39.4% |
| Immigrants | Barbados | 0.0 /100 | #330 | Tragic 39.2% |
| Immigrants | Congo | 0.0 /100 | #331 | Tragic 39.0% |
| Somalis | 0.0 /100 | #332 | Tragic 39.0% |
| Immigrants | West Indies | 0.0 /100 | #333 | Tragic 39.0% |
| Immigrants | St. Vincent and the Grenadines | 0.0 /100 | #334 | Tragic 38.7% |
| Senegalese | 0.0 /100 | #335 | Tragic 38.6% |