Malaysian vs Immigrants from Peru Average Family Size
COMPARE
Malaysian
Immigrants from Peru
Average Family Size
Average Family Size Comparison
Malaysians
Immigrants from Peru
3.31
AVERAGE FAMILY SIZE
99.6/ 100
METRIC RATING
89th/ 347
METRIC RANK
3.31
AVERAGE FAMILY SIZE
99.7/ 100
METRIC RATING
87th/ 347
METRIC RANK
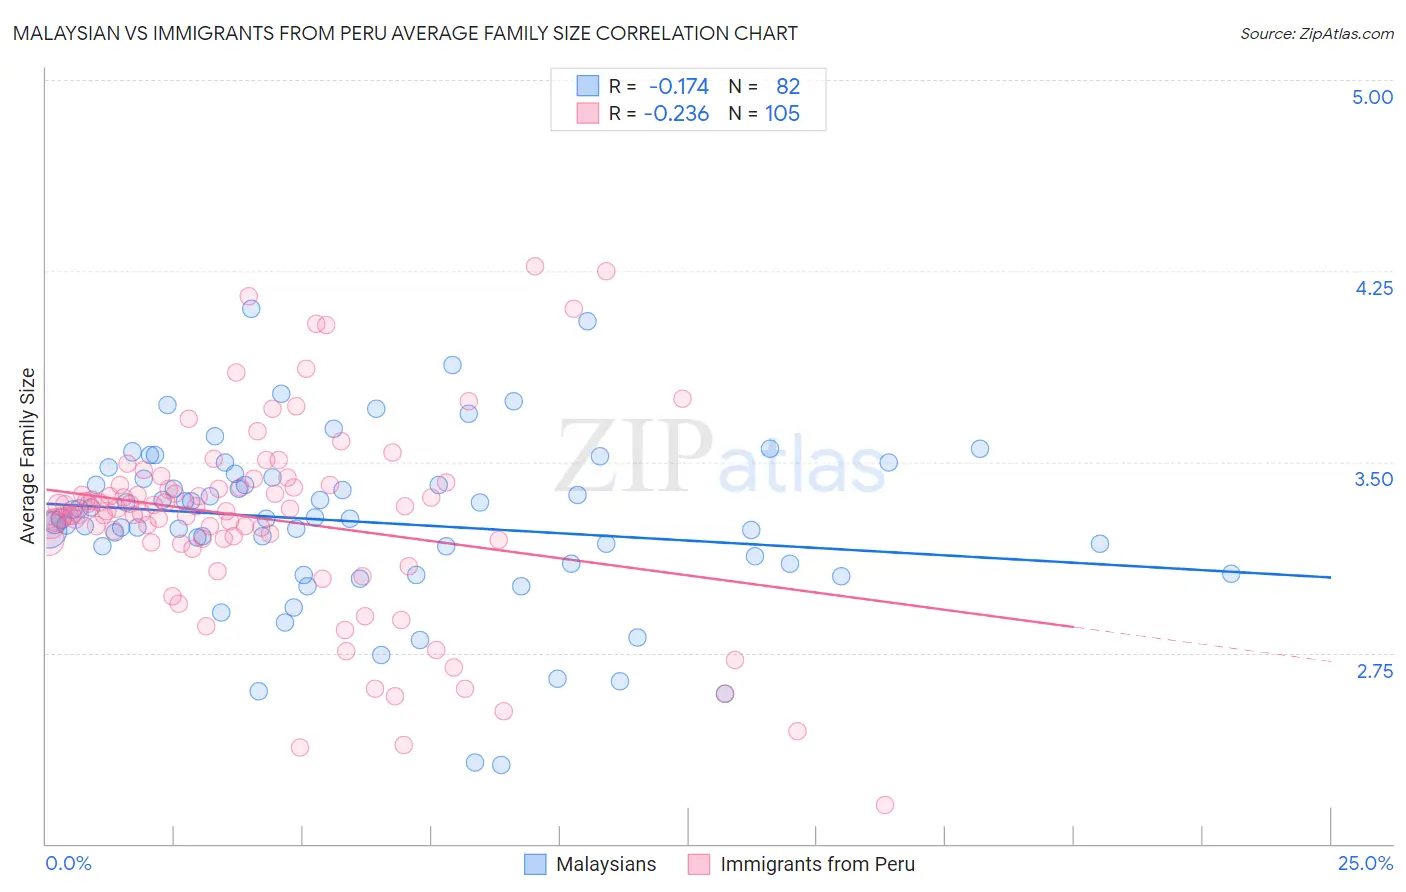
Malaysian vs Immigrants from Peru Average Family Size Correlation Chart
The statistical analysis conducted on geographies consisting of 226,011,671 people shows a poor negative correlation between the proportion of Malaysians and average family size in the United States with a correlation coefficient (R) of -0.174 and weighted average of 3.31. Similarly, the statistical analysis conducted on geographies consisting of 328,761,601 people shows a weak negative correlation between the proportion of Immigrants from Peru and average family size in the United States with a correlation coefficient (R) of -0.236 and weighted average of 3.31, a difference of 0.10%.
Average Family Size Correlation Summary
| Measurement | Malaysian | Immigrants from Peru |
| Minimum | 2.31 | 2.15 |
| Maximum | 4.10 | 4.27 |
| Range | 1.79 | 2.12 |
| Mean | 3.26 | 3.28 |
| Median | 3.28 | 3.31 |
| Interquartile 25% (IQ1) | 3.10 | 3.19 |
| Interquartile 75% (IQ3) | 3.44 | 3.41 |
| Interquartile Range (IQR) | 0.34 | 0.22 |
| Standard Deviation (Sample) | 0.33 | 0.38 |
| Standard Deviation (Population) | 0.33 | 0.38 |
Demographics Similar to Malaysians and Immigrants from Peru by Average Family Size
In terms of average family size, the demographic groups most similar to Malaysians are Immigrants from Bolivia (3.31, a difference of 0.010%), Menominee (3.30, a difference of 0.11%), Jamaican (3.31, a difference of 0.15%), Afghan (3.31, a difference of 0.17%), and Immigrants from Nigeria (3.32, a difference of 0.21%). Similarly, the demographic groups most similar to Immigrants from Peru are Jamaican (3.31, a difference of 0.050%), Afghan (3.31, a difference of 0.070%), Immigrants from Bolivia (3.31, a difference of 0.090%), Immigrants from Nigeria (3.32, a difference of 0.12%), and Immigrants from Afghanistan (3.32, a difference of 0.15%).
| Demographics | Rating | Rank | Average Family Size |
| Immigrants | Micronesia | 99.8 /100 | #78 | Exceptional 3.32 |
| British West Indians | 99.8 /100 | #79 | Exceptional 3.32 |
| Lumbee | 99.8 /100 | #80 | Exceptional 3.32 |
| Immigrants | Dominica | 99.8 /100 | #81 | Exceptional 3.32 |
| Ecuadorians | 99.8 /100 | #82 | Exceptional 3.32 |
| Immigrants | Afghanistan | 99.8 /100 | #83 | Exceptional 3.32 |
| Immigrants | Nigeria | 99.7 /100 | #84 | Exceptional 3.32 |
| Afghans | 99.7 /100 | #85 | Exceptional 3.31 |
| Jamaicans | 99.7 /100 | #86 | Exceptional 3.31 |
| Immigrants | Peru | 99.7 /100 | #87 | Exceptional 3.31 |
| Immigrants | Bolivia | 99.6 /100 | #88 | Exceptional 3.31 |
| Malaysians | 99.6 /100 | #89 | Exceptional 3.31 |
| Menominee | 99.4 /100 | #90 | Exceptional 3.30 |
| Immigrants | Pakistan | 99.2 /100 | #91 | Exceptional 3.30 |
| Immigrants | Cameroon | 99.2 /100 | #92 | Exceptional 3.30 |
| Peruvians | 99.2 /100 | #93 | Exceptional 3.30 |
| Sierra Leoneans | 99.0 /100 | #94 | Exceptional 3.30 |
| Immigrants | Lebanon | 99.0 /100 | #95 | Exceptional 3.30 |
| U.S. Virgin Islanders | 98.8 /100 | #96 | Exceptional 3.29 |
| Immigrants | Oceania | 98.7 /100 | #97 | Exceptional 3.29 |
| Barbadians | 98.6 /100 | #98 | Exceptional 3.29 |