Malaysian vs Immigrants from Uganda Currently Married
COMPARE
Malaysian
Immigrants from Uganda
Currently Married
Currently Married Comparison
Malaysians
Immigrants from Uganda
45.9%
CURRENTLY MARRIED
15.3/ 100
METRIC RATING
201st/ 347
METRIC RANK
45.0%
CURRENTLY MARRIED
2.2/ 100
METRIC RATING
224th/ 347
METRIC RANK
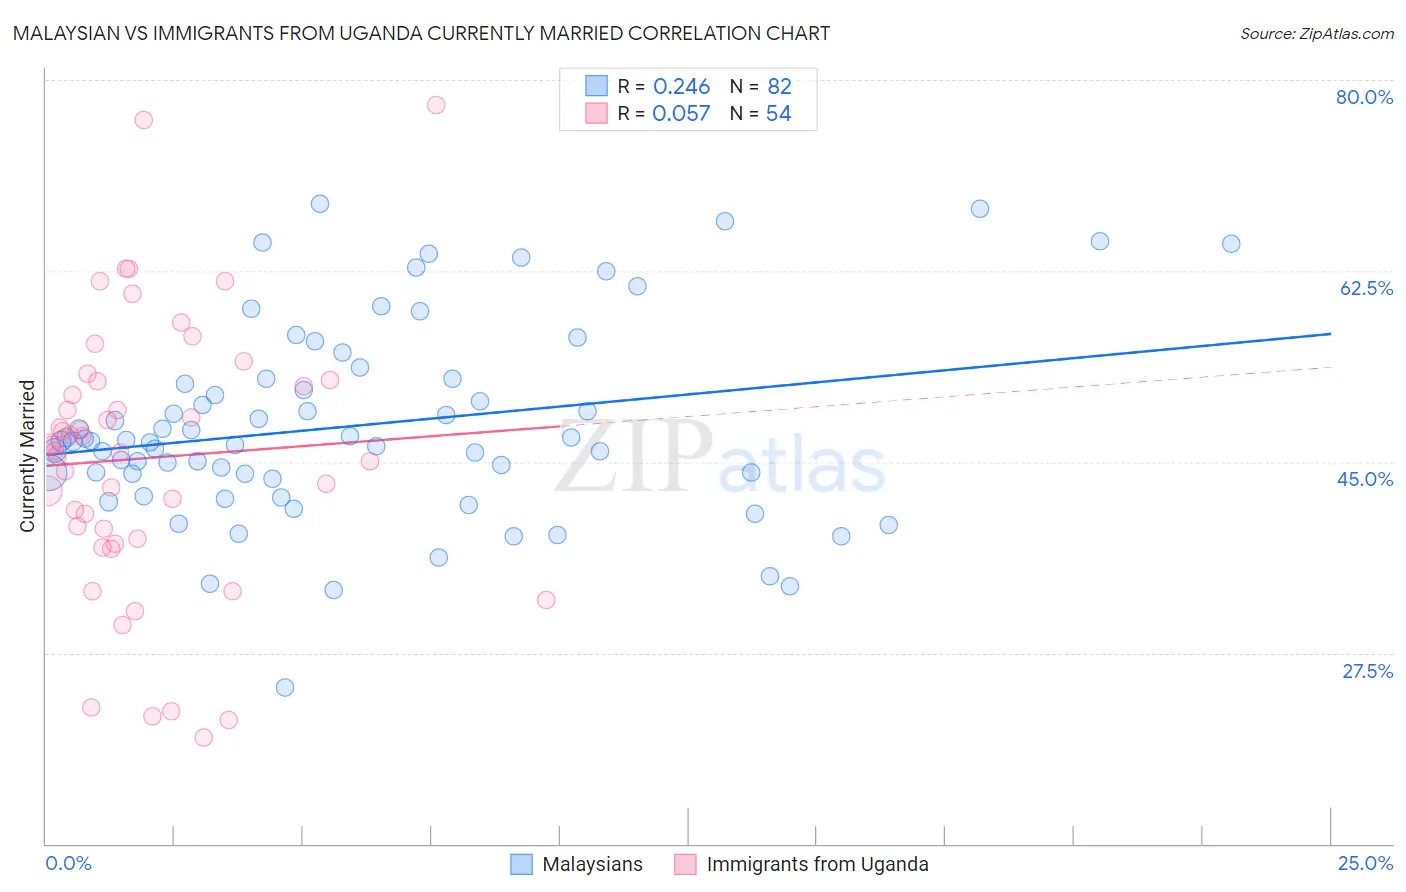
Malaysian vs Immigrants from Uganda Currently Married Correlation Chart
The statistical analysis conducted on geographies consisting of 226,093,582 people shows a weak positive correlation between the proportion of Malaysians and percentage of population currently married in the United States with a correlation coefficient (R) of 0.246 and weighted average of 45.9%. Similarly, the statistical analysis conducted on geographies consisting of 125,979,600 people shows a slight positive correlation between the proportion of Immigrants from Uganda and percentage of population currently married in the United States with a correlation coefficient (R) of 0.057 and weighted average of 45.0%, a difference of 2.0%.
Currently Married Correlation Summary
| Measurement | Malaysian | Immigrants from Uganda |
| Minimum | 24.3% | 19.7% |
| Maximum | 68.6% | 77.7% |
| Range | 44.3% | 58.0% |
| Mean | 48.3% | 45.4% |
| Median | 46.9% | 46.2% |
| Interquartile 25% (IQ1) | 43.9% | 38.0% |
| Interquartile 75% (IQ3) | 52.6% | 52.4% |
| Interquartile Range (IQR) | 8.7% | 14.5% |
| Standard Deviation (Sample) | 8.9% | 12.5% |
| Standard Deviation (Population) | 8.9% | 12.4% |
Similar Demographics by Currently Married
Demographics Similar to Malaysians by Currently Married
In terms of currently married, the demographic groups most similar to Malaysians are Immigrants from Albania (45.9%, a difference of 0.060%), Creek (46.0%, a difference of 0.13%), Immigrants from Costa Rica (46.0%, a difference of 0.27%), Taiwanese (45.8%, a difference of 0.29%), and Immigrants from Spain (45.8%, a difference of 0.30%).
| Demographics | Rating | Rank | Currently Married |
| South Americans | 23.8 /100 | #194 | Fair 46.1% |
| Immigrants | Nepal | 23.7 /100 | #195 | Fair 46.1% |
| Immigrants | Bosnia and Herzegovina | 22.2 /100 | #196 | Fair 46.1% |
| Immigrants | Kuwait | 21.7 /100 | #197 | Fair 46.1% |
| Immigrants | Colombia | 21.0 /100 | #198 | Fair 46.1% |
| Immigrants | Costa Rica | 19.6 /100 | #199 | Poor 46.0% |
| Creek | 17.2 /100 | #200 | Poor 46.0% |
| Malaysians | 15.3 /100 | #201 | Poor 45.9% |
| Immigrants | Albania | 14.5 /100 | #202 | Poor 45.9% |
| Taiwanese | 11.7 /100 | #203 | Poor 45.8% |
| Immigrants | Spain | 11.6 /100 | #204 | Poor 45.8% |
| South American Indians | 11.5 /100 | #205 | Poor 45.8% |
| Immigrants | Immigrants | 11.2 /100 | #206 | Poor 45.8% |
| Immigrants | South America | 10.8 /100 | #207 | Poor 45.7% |
| Alsatians | 10.8 /100 | #208 | Poor 45.7% |
Demographics Similar to Immigrants from Uganda by Currently Married
In terms of currently married, the demographic groups most similar to Immigrants from Uganda are French American Indian (45.0%, a difference of 0.0%), Immigrants from Laos (45.0%, a difference of 0.050%), Comanche (45.0%, a difference of 0.050%), Spanish American (45.0%, a difference of 0.060%), and Immigrants from Uruguay (45.0%, a difference of 0.060%).
| Demographics | Rating | Rank | Currently Married |
| Immigrants | Thailand | 5.1 /100 | #217 | Tragic 45.4% |
| Panamanians | 4.0 /100 | #218 | Tragic 45.3% |
| Immigrants | Portugal | 3.5 /100 | #219 | Tragic 45.2% |
| Kenyans | 3.1 /100 | #220 | Tragic 45.2% |
| Mexicans | 3.0 /100 | #221 | Tragic 45.2% |
| Immigrants | Azores | 2.5 /100 | #222 | Tragic 45.1% |
| Immigrants | Laos | 2.3 /100 | #223 | Tragic 45.0% |
| Immigrants | Uganda | 2.2 /100 | #224 | Tragic 45.0% |
| French American Indians | 2.2 /100 | #225 | Tragic 45.0% |
| Comanche | 2.1 /100 | #226 | Tragic 45.0% |
| Spanish Americans | 2.1 /100 | #227 | Tragic 45.0% |
| Immigrants | Uruguay | 2.0 /100 | #228 | Tragic 45.0% |
| Cree | 1.7 /100 | #229 | Tragic 44.9% |
| Immigrants | Kenya | 1.6 /100 | #230 | Tragic 44.9% |
| Immigrants | Panama | 1.5 /100 | #231 | Tragic 44.9% |