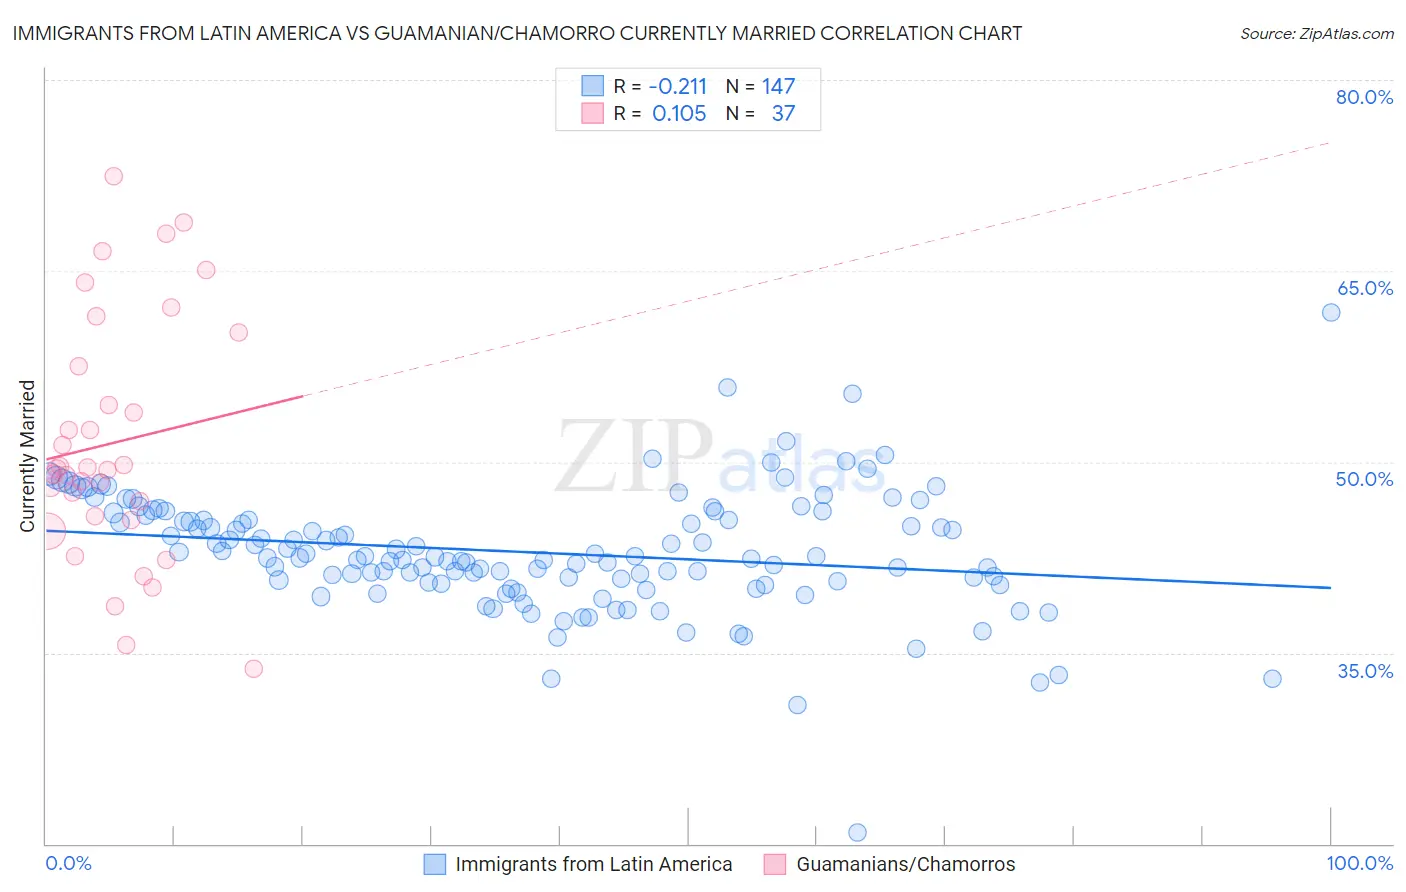
Immigrants from Latin America vs Guamanian/Chamorro Currently Married
COMPARE
Immigrants from Latin America
Guamanian/Chamorro
Currently Married
Currently Married Comparison
Immigrants from Latin America
Guamanians/Chamorros
43.8%
CURRENTLY MARRIED
0.1/ 100
METRIC RATING
260th/ 347
METRIC RANK
47.1%
CURRENTLY MARRIED
74.2/ 100
METRIC RATING
143rd/ 347
METRIC RANK
Immigrants from Latin America vs Guamanian/Chamorro Currently Married Correlation Chart
The statistical analysis conducted on geographies consisting of 558,538,971 people shows a weak negative correlation between the proportion of Immigrants from Latin America and percentage of population currently married in the United States with a correlation coefficient (R) of -0.211 and weighted average of 43.8%. Similarly, the statistical analysis conducted on geographies consisting of 221,951,395 people shows a poor positive correlation between the proportion of Guamanians/Chamorros and percentage of population currently married in the United States with a correlation coefficient (R) of 0.105 and weighted average of 47.1%, a difference of 7.6%.
Currently Married Correlation Summary
| Measurement | Immigrants from Latin America | Guamanian/Chamorro |
| Minimum | 20.9% | 33.7% |
| Maximum | 61.8% | 72.4% |
| Range | 40.9% | 38.7% |
| Mean | 42.9% | 51.5% |
| Median | 42.5% | 49.5% |
| Interquartile 25% (IQ1) | 40.6% | 45.6% |
| Interquartile 75% (IQ3) | 45.8% | 58.9% |
| Interquartile Range (IQR) | 5.2% | 13.3% |
| Standard Deviation (Sample) | 4.8% | 9.5% |
| Standard Deviation (Population) | 4.8% | 9.4% |
Similar Demographics by Currently Married
Demographics Similar to Immigrants from Latin America by Currently Married
In terms of currently married, the demographic groups most similar to Immigrants from Latin America are Immigrants from Nicaragua (43.7%, a difference of 0.040%), Immigrants from Sierra Leone (43.8%, a difference of 0.060%), Bangladeshi (43.7%, a difference of 0.18%), Immigrants from Cuba (43.7%, a difference of 0.22%), and Sudanese (43.7%, a difference of 0.24%).
| Demographics | Rating | Rank | Currently Married |
| Immigrants | Central America | 0.3 /100 | #253 | Tragic 44.1% |
| Vietnamese | 0.2 /100 | #254 | Tragic 44.0% |
| Yakama | 0.2 /100 | #255 | Tragic 44.0% |
| Shoshone | 0.2 /100 | #256 | Tragic 44.0% |
| Immigrants | Africa | 0.2 /100 | #257 | Tragic 43.9% |
| Ute | 0.2 /100 | #258 | Tragic 43.9% |
| Immigrants | Sierra Leone | 0.1 /100 | #259 | Tragic 43.8% |
| Immigrants | Latin America | 0.1 /100 | #260 | Tragic 43.8% |
| Immigrants | Nicaragua | 0.1 /100 | #261 | Tragic 43.7% |
| Bangladeshis | 0.1 /100 | #262 | Tragic 43.7% |
| Immigrants | Cuba | 0.1 /100 | #263 | Tragic 43.7% |
| Sudanese | 0.1 /100 | #264 | Tragic 43.7% |
| Immigrants | Bangladesh | 0.1 /100 | #265 | Tragic 43.6% |
| Ecuadorians | 0.1 /100 | #266 | Tragic 43.6% |
| Immigrants | Eritrea | 0.1 /100 | #267 | Tragic 43.6% |
Demographics Similar to Guamanians/Chamorros by Currently Married
In terms of currently married, the demographic groups most similar to Guamanians/Chamorros are Venezuelan (47.1%, a difference of 0.010%), Argentinean (47.1%, a difference of 0.010%), Hmong (47.1%, a difference of 0.040%), Cajun (47.1%, a difference of 0.050%), and Immigrants from South Eastern Asia (47.1%, a difference of 0.060%).
| Demographics | Rating | Rank | Currently Married |
| Immigrants | Vietnam | 78.2 /100 | #136 | Good 47.2% |
| Paraguayans | 77.8 /100 | #137 | Good 47.2% |
| Pakistanis | 77.5 /100 | #138 | Good 47.2% |
| Yugoslavians | 77.4 /100 | #139 | Good 47.2% |
| Cajuns | 75.3 /100 | #140 | Good 47.1% |
| Venezuelans | 74.4 /100 | #141 | Good 47.1% |
| Argentineans | 74.4 /100 | #142 | Good 47.1% |
| Guamanians/Chamorros | 74.2 /100 | #143 | Good 47.1% |
| Hmong | 73.4 /100 | #144 | Good 47.1% |
| Immigrants | South Eastern Asia | 72.9 /100 | #145 | Good 47.1% |
| Carpatho Rusyns | 72.6 /100 | #146 | Good 47.0% |
| Immigrants | Argentina | 72.0 /100 | #147 | Good 47.0% |
| Cambodians | 70.4 /100 | #148 | Good 47.0% |
| Zimbabweans | 70.1 /100 | #149 | Good 47.0% |
| Immigrants | Turkey | 70.0 /100 | #150 | Good 47.0% |