Okinawan vs Guamanian/Chamorro Currently Married
COMPARE
Okinawan
Guamanian/Chamorro
Currently Married
Currently Married Comparison
Okinawans
Guamanians/Chamorros
47.4%
CURRENTLY MARRIED
85.3/ 100
METRIC RATING
125th/ 347
METRIC RANK
47.1%
CURRENTLY MARRIED
74.2/ 100
METRIC RATING
143rd/ 347
METRIC RANK
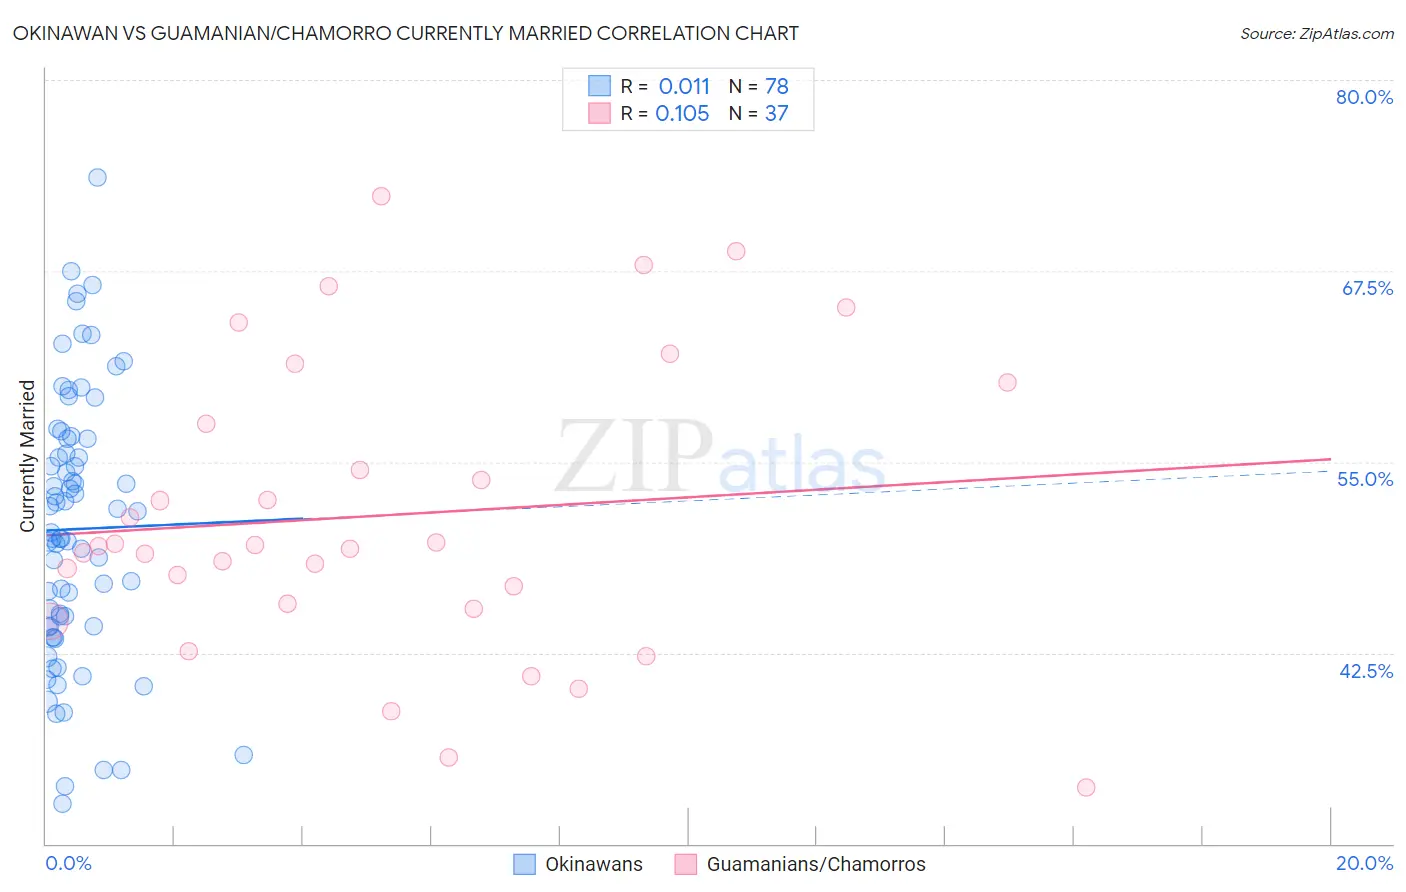
Okinawan vs Guamanian/Chamorro Currently Married Correlation Chart
The statistical analysis conducted on geographies consisting of 73,772,528 people shows no correlation between the proportion of Okinawans and percentage of population currently married in the United States with a correlation coefficient (R) of 0.011 and weighted average of 47.4%. Similarly, the statistical analysis conducted on geographies consisting of 221,951,395 people shows a poor positive correlation between the proportion of Guamanians/Chamorros and percentage of population currently married in the United States with a correlation coefficient (R) of 0.105 and weighted average of 47.1%, a difference of 0.63%.
Currently Married Correlation Summary
| Measurement | Okinawan | Guamanian/Chamorro |
| Minimum | 32.6% | 33.7% |
| Maximum | 73.6% | 72.4% |
| Range | 41.0% | 38.7% |
| Mean | 50.6% | 51.5% |
| Median | 50.2% | 49.5% |
| Interquartile 25% (IQ1) | 44.2% | 45.6% |
| Interquartile 75% (IQ3) | 56.5% | 58.9% |
| Interquartile Range (IQR) | 12.3% | 13.3% |
| Standard Deviation (Sample) | 8.7% | 9.5% |
| Standard Deviation (Population) | 8.7% | 9.4% |
Demographics Similar to Okinawans and Guamanians/Chamorros by Currently Married
In terms of currently married, the demographic groups most similar to Okinawans are Immigrants from Jordan (47.4%, a difference of 0.030%), New Zealander (47.4%, a difference of 0.030%), Portuguese (47.3%, a difference of 0.080%), Laotian (47.4%, a difference of 0.10%), and Sri Lankan (47.3%, a difference of 0.14%). Similarly, the demographic groups most similar to Guamanians/Chamorros are Venezuelan (47.1%, a difference of 0.010%), Argentinean (47.1%, a difference of 0.010%), Hmong (47.1%, a difference of 0.040%), Cajun (47.1%, a difference of 0.050%), and Pakistani (47.2%, a difference of 0.16%).
| Demographics | Rating | Rank | Currently Married |
| Laotians | 86.6 /100 | #124 | Excellent 47.4% |
| Okinawans | 85.3 /100 | #125 | Excellent 47.4% |
| Immigrants | Jordan | 84.9 /100 | #126 | Excellent 47.4% |
| New Zealanders | 84.9 /100 | #127 | Excellent 47.4% |
| Portuguese | 84.2 /100 | #128 | Excellent 47.3% |
| Sri Lankans | 83.2 /100 | #129 | Excellent 47.3% |
| Immigrants | Iraq | 82.8 /100 | #130 | Excellent 47.3% |
| Icelanders | 82.4 /100 | #131 | Excellent 47.3% |
| Afghans | 81.8 /100 | #132 | Excellent 47.3% |
| Immigrants | Malaysia | 81.1 /100 | #133 | Excellent 47.3% |
| Immigrants | Australia | 81.1 /100 | #134 | Excellent 47.3% |
| Immigrants | Norway | 79.7 /100 | #135 | Good 47.2% |
| Immigrants | Vietnam | 78.2 /100 | #136 | Good 47.2% |
| Paraguayans | 77.8 /100 | #137 | Good 47.2% |
| Pakistanis | 77.5 /100 | #138 | Good 47.2% |
| Yugoslavians | 77.4 /100 | #139 | Good 47.2% |
| Cajuns | 75.3 /100 | #140 | Good 47.1% |
| Venezuelans | 74.4 /100 | #141 | Good 47.1% |
| Argentineans | 74.4 /100 | #142 | Good 47.1% |
| Guamanians/Chamorros | 74.2 /100 | #143 | Good 47.1% |
| Hmong | 73.4 /100 | #144 | Good 47.1% |