Luxembourger vs Russian Divorced or Separated
COMPARE
Luxembourger
Russian
Divorced or Separated
Divorced or Separated Comparison
Luxembourgers
Russians
11.3%
DIVORCED OR SEPARATED
99.9/ 100
METRIC RATING
62nd/ 347
METRIC RANK
11.5%
DIVORCED OR SEPARATED
99.4/ 100
METRIC RATING
81st/ 347
METRIC RANK
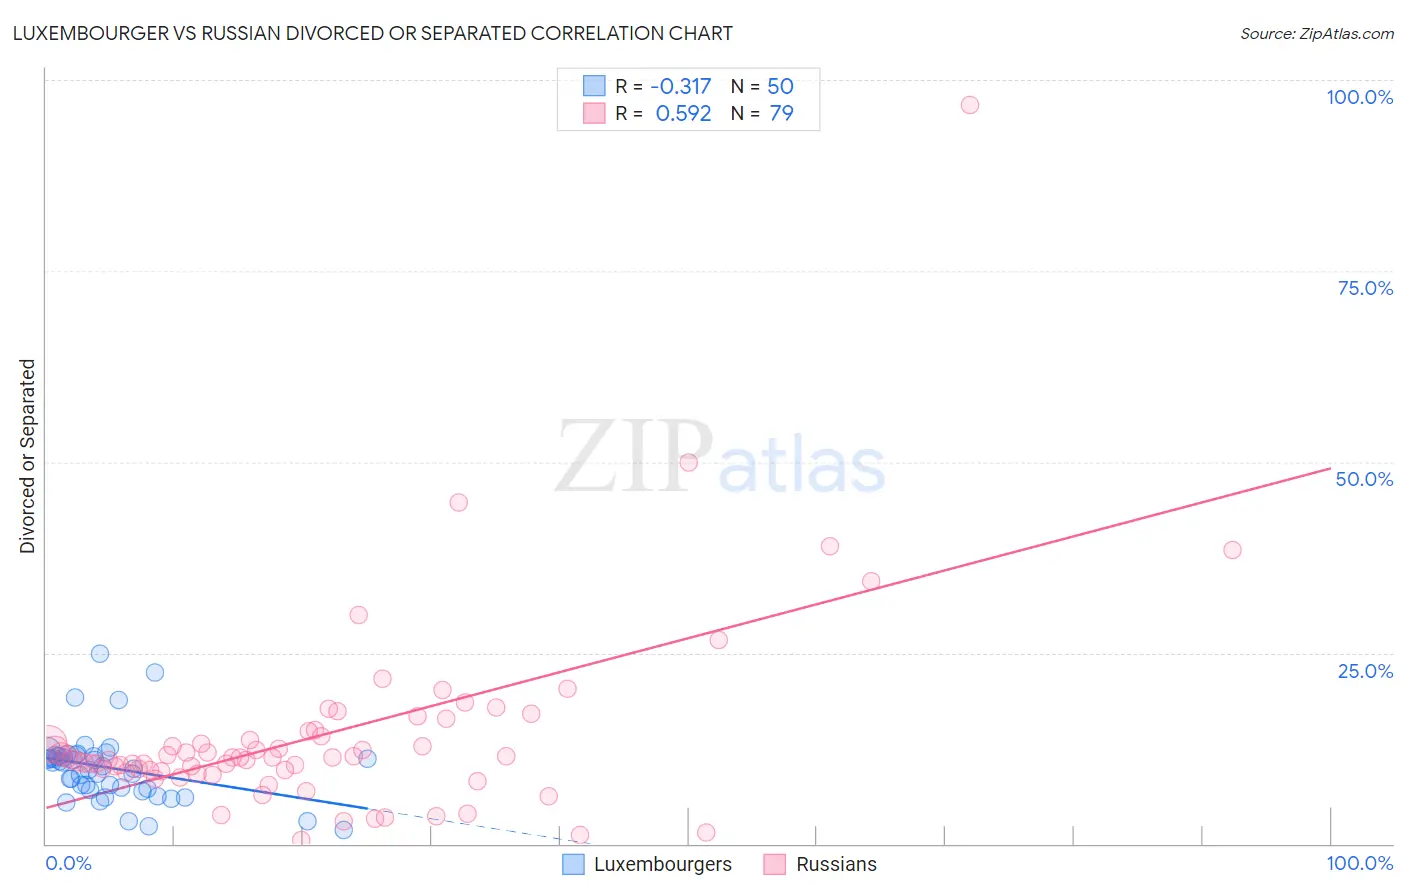
Luxembourger vs Russian Divorced or Separated Correlation Chart
The statistical analysis conducted on geographies consisting of 144,652,195 people shows a mild negative correlation between the proportion of Luxembourgers and percentage of population currently divorced or separated in the United States with a correlation coefficient (R) of -0.317 and weighted average of 11.3%. Similarly, the statistical analysis conducted on geographies consisting of 511,901,777 people shows a substantial positive correlation between the proportion of Russians and percentage of population currently divorced or separated in the United States with a correlation coefficient (R) of 0.592 and weighted average of 11.5%, a difference of 1.5%.
Divorced or Separated Correlation Summary
| Measurement | Luxembourger | Russian |
| Minimum | 1.8% | 0.50% |
| Maximum | 24.8% | 96.8% |
| Range | 23.0% | 96.3% |
| Mean | 9.9% | 14.3% |
| Median | 10.4% | 11.3% |
| Interquartile 25% (IQ1) | 7.2% | 9.6% |
| Interquartile 75% (IQ3) | 11.5% | 14.8% |
| Interquartile Range (IQR) | 4.3% | 5.2% |
| Standard Deviation (Sample) | 4.5% | 13.0% |
| Standard Deviation (Population) | 4.4% | 12.9% |
Demographics Similar to Luxembourgers and Russians by Divorced or Separated
In terms of divorced or separated, the demographic groups most similar to Luxembourgers are Korean (11.3%, a difference of 0.0%), Immigrants from Kuwait (11.3%, a difference of 0.010%), Macedonian (11.4%, a difference of 0.52%), Immigrants from South Eastern Asia (11.4%, a difference of 0.56%), and Inupiat (11.4%, a difference of 0.69%). Similarly, the demographic groups most similar to Russians are Immigrants from Switzerland (11.5%, a difference of 0.010%), Guyanese (11.5%, a difference of 0.030%), Afghan (11.5%, a difference of 0.070%), Immigrants from Italy (11.5%, a difference of 0.17%), and Albanian (11.5%, a difference of 0.29%).
| Demographics | Rating | Rank | Divorced or Separated |
| Koreans | 99.9 /100 | #61 | Exceptional 11.3% |
| Luxembourgers | 99.9 /100 | #62 | Exceptional 11.3% |
| Immigrants | Kuwait | 99.9 /100 | #63 | Exceptional 11.3% |
| Macedonians | 99.8 /100 | #64 | Exceptional 11.4% |
| Immigrants | South Eastern Asia | 99.8 /100 | #65 | Exceptional 11.4% |
| Inupiat | 99.8 /100 | #66 | Exceptional 11.4% |
| Immigrants | Syria | 99.7 /100 | #67 | Exceptional 11.4% |
| Palestinians | 99.7 /100 | #68 | Exceptional 11.5% |
| Immigrants | Belgium | 99.7 /100 | #69 | Exceptional 11.5% |
| Immigrants | Eastern Europe | 99.7 /100 | #70 | Exceptional 11.5% |
| Paraguayans | 99.7 /100 | #71 | Exceptional 11.5% |
| Jordanians | 99.6 /100 | #72 | Exceptional 11.5% |
| Immigrants | North Macedonia | 99.6 /100 | #73 | Exceptional 11.5% |
| Taiwanese | 99.6 /100 | #74 | Exceptional 11.5% |
| Immigrants | Northern Africa | 99.6 /100 | #75 | Exceptional 11.5% |
| Albanians | 99.6 /100 | #76 | Exceptional 11.5% |
| Immigrants | Italy | 99.5 /100 | #77 | Exceptional 11.5% |
| Afghans | 99.4 /100 | #78 | Exceptional 11.5% |
| Guyanese | 99.4 /100 | #79 | Exceptional 11.5% |
| Immigrants | Switzerland | 99.4 /100 | #80 | Exceptional 11.5% |
| Russians | 99.4 /100 | #81 | Exceptional 11.5% |