Luxembourger vs Trinidadian and Tobagonian Divorced or Separated
COMPARE
Luxembourger
Trinidadian and Tobagonian
Divorced or Separated
Divorced or Separated Comparison
Luxembourgers
Trinidadians and Tobagonians
11.3%
DIVORCED OR SEPARATED
99.9/ 100
METRIC RATING
62nd/ 347
METRIC RANK
12.2%
DIVORCED OR SEPARATED
16.6/ 100
METRIC RATING
211th/ 347
METRIC RANK
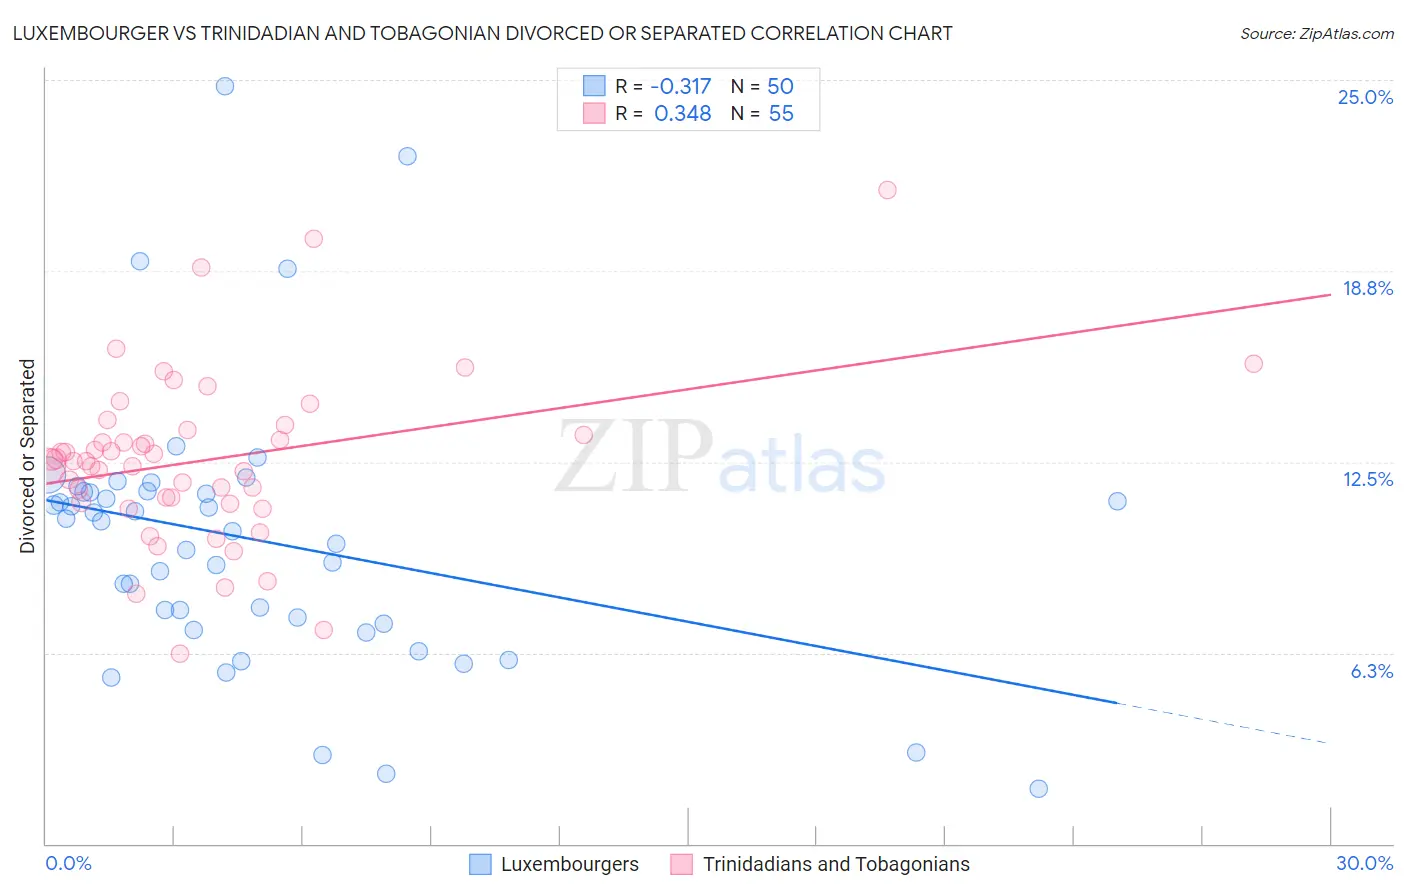
Luxembourger vs Trinidadian and Tobagonian Divorced or Separated Correlation Chart
The statistical analysis conducted on geographies consisting of 144,652,195 people shows a mild negative correlation between the proportion of Luxembourgers and percentage of population currently divorced or separated in the United States with a correlation coefficient (R) of -0.317 and weighted average of 11.3%. Similarly, the statistical analysis conducted on geographies consisting of 219,763,096 people shows a mild positive correlation between the proportion of Trinidadians and Tobagonians and percentage of population currently divorced or separated in the United States with a correlation coefficient (R) of 0.348 and weighted average of 12.2%, a difference of 7.7%.
Divorced or Separated Correlation Summary
| Measurement | Luxembourger | Trinidadian and Tobagonian |
| Minimum | 1.8% | 6.2% |
| Maximum | 24.8% | 21.4% |
| Range | 23.0% | 15.2% |
| Mean | 9.9% | 12.6% |
| Median | 10.4% | 12.5% |
| Interquartile 25% (IQ1) | 7.2% | 11.2% |
| Interquartile 75% (IQ3) | 11.5% | 13.5% |
| Interquartile Range (IQR) | 4.3% | 2.3% |
| Standard Deviation (Sample) | 4.5% | 2.8% |
| Standard Deviation (Population) | 4.4% | 2.7% |
Similar Demographics by Divorced or Separated
Demographics Similar to Luxembourgers by Divorced or Separated
In terms of divorced or separated, the demographic groups most similar to Luxembourgers are Korean (11.3%, a difference of 0.0%), Immigrants from Russia (11.3%, a difference of 0.010%), Immigrants from Kuwait (11.3%, a difference of 0.010%), Israeli (11.3%, a difference of 0.17%), and Sri Lankan (11.3%, a difference of 0.27%).
| Demographics | Rating | Rank | Divorced or Separated |
| Immigrants | Yemen | 99.9 /100 | #55 | Exceptional 11.3% |
| Immigrants | Philippines | 99.9 /100 | #56 | Exceptional 11.3% |
| Immigrants | Vietnam | 99.9 /100 | #57 | Exceptional 11.3% |
| Sri Lankans | 99.9 /100 | #58 | Exceptional 11.3% |
| Israelis | 99.9 /100 | #59 | Exceptional 11.3% |
| Immigrants | Russia | 99.9 /100 | #60 | Exceptional 11.3% |
| Koreans | 99.9 /100 | #61 | Exceptional 11.3% |
| Luxembourgers | 99.9 /100 | #62 | Exceptional 11.3% |
| Immigrants | Kuwait | 99.9 /100 | #63 | Exceptional 11.3% |
| Macedonians | 99.8 /100 | #64 | Exceptional 11.4% |
| Immigrants | South Eastern Asia | 99.8 /100 | #65 | Exceptional 11.4% |
| Inupiat | 99.8 /100 | #66 | Exceptional 11.4% |
| Immigrants | Syria | 99.7 /100 | #67 | Exceptional 11.4% |
| Palestinians | 99.7 /100 | #68 | Exceptional 11.5% |
| Immigrants | Belgium | 99.7 /100 | #69 | Exceptional 11.5% |
Demographics Similar to Trinidadians and Tobagonians by Divorced or Separated
In terms of divorced or separated, the demographic groups most similar to Trinidadians and Tobagonians are Immigrants from Kenya (12.2%, a difference of 0.010%), Slavic (12.2%, a difference of 0.020%), Immigrants from Eastern Africa (12.2%, a difference of 0.030%), Immigrants from Trinidad and Tobago (12.2%, a difference of 0.070%), and Immigrants from Argentina (12.2%, a difference of 0.070%).
| Demographics | Rating | Rank | Divorced or Separated |
| Kenyans | 21.8 /100 | #204 | Fair 12.2% |
| Immigrants | Costa Rica | 21.3 /100 | #205 | Fair 12.2% |
| Slovaks | 21.0 /100 | #206 | Fair 12.2% |
| Mexicans | 21.0 /100 | #207 | Fair 12.2% |
| Immigrants | Ghana | 18.8 /100 | #208 | Poor 12.2% |
| Immigrants | Trinidad and Tobago | 17.8 /100 | #209 | Poor 12.2% |
| Slavs | 17.0 /100 | #210 | Poor 12.2% |
| Trinidadians and Tobagonians | 16.6 /100 | #211 | Poor 12.2% |
| Immigrants | Kenya | 16.5 /100 | #212 | Poor 12.2% |
| Immigrants | Eastern Africa | 16.2 /100 | #213 | Poor 12.2% |
| Immigrants | Argentina | 15.5 /100 | #214 | Poor 12.2% |
| Europeans | 15.4 /100 | #215 | Poor 12.2% |
| Immigrants | South America | 15.4 /100 | #216 | Poor 12.2% |
| Northern Europeans | 14.7 /100 | #217 | Poor 12.2% |
| Slovenes | 13.2 /100 | #218 | Poor 12.3% |