Luxembourger vs Chinese Divorced or Separated
COMPARE
Luxembourger
Chinese
Divorced or Separated
Divorced or Separated Comparison
Luxembourgers
Chinese
11.3%
DIVORCED OR SEPARATED
99.9/ 100
METRIC RATING
62nd/ 347
METRIC RANK
11.2%
DIVORCED OR SEPARATED
100.0/ 100
METRIC RATING
42nd/ 347
METRIC RANK
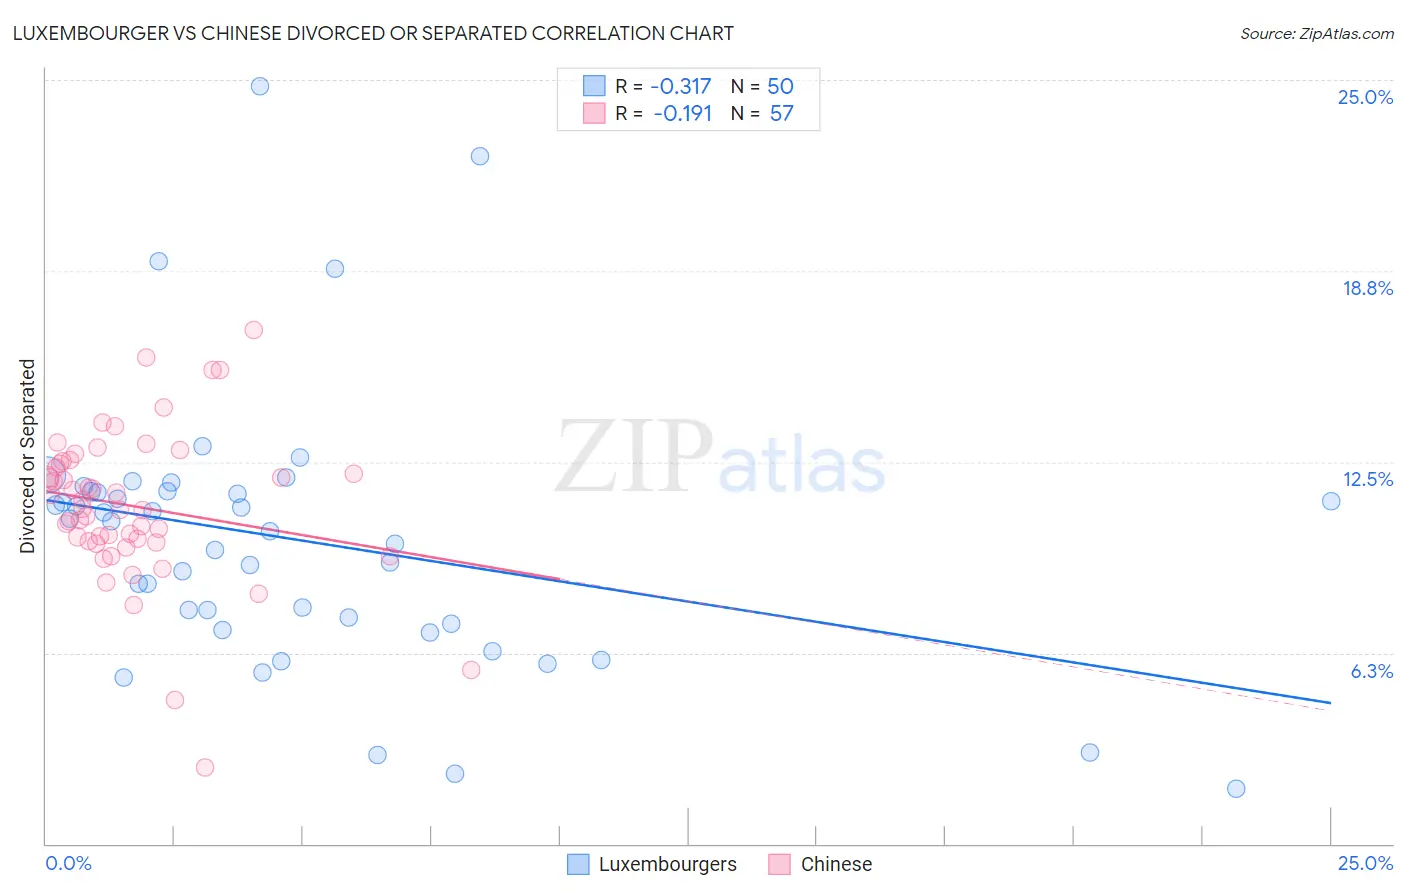
Luxembourger vs Chinese Divorced or Separated Correlation Chart
The statistical analysis conducted on geographies consisting of 144,652,195 people shows a mild negative correlation between the proportion of Luxembourgers and percentage of population currently divorced or separated in the United States with a correlation coefficient (R) of -0.317 and weighted average of 11.3%. Similarly, the statistical analysis conducted on geographies consisting of 64,808,439 people shows a poor negative correlation between the proportion of Chinese and percentage of population currently divorced or separated in the United States with a correlation coefficient (R) of -0.191 and weighted average of 11.2%, a difference of 1.5%.
Divorced or Separated Correlation Summary
| Measurement | Luxembourger | Chinese |
| Minimum | 1.8% | 2.5% |
| Maximum | 24.8% | 16.8% |
| Range | 23.0% | 14.3% |
| Mean | 9.9% | 11.1% |
| Median | 10.4% | 11.0% |
| Interquartile 25% (IQ1) | 7.2% | 9.9% |
| Interquartile 75% (IQ3) | 11.5% | 12.5% |
| Interquartile Range (IQR) | 4.3% | 2.6% |
| Standard Deviation (Sample) | 4.5% | 2.5% |
| Standard Deviation (Population) | 4.4% | 2.5% |
Demographics Similar to Luxembourgers and Chinese by Divorced or Separated
In terms of divorced or separated, the demographic groups most similar to Luxembourgers are Korean (11.3%, a difference of 0.0%), Immigrants from Russia (11.3%, a difference of 0.010%), Israeli (11.3%, a difference of 0.17%), Sri Lankan (11.3%, a difference of 0.27%), and Immigrants from Vietnam (11.3%, a difference of 0.33%). Similarly, the demographic groups most similar to Chinese are Immigrants from Belarus (11.2%, a difference of 0.010%), Immigrants from Western Asia (11.2%, a difference of 0.020%), Turkish (11.2%, a difference of 0.070%), Laotian (11.2%, a difference of 0.18%), and Immigrants from Poland (11.2%, a difference of 0.19%).
| Demographics | Rating | Rank | Divorced or Separated |
| Chinese | 100.0 /100 | #42 | Exceptional 11.2% |
| Immigrants | Belarus | 100.0 /100 | #43 | Exceptional 11.2% |
| Immigrants | Western Asia | 100.0 /100 | #44 | Exceptional 11.2% |
| Turks | 100.0 /100 | #45 | Exceptional 11.2% |
| Laotians | 100.0 /100 | #46 | Exceptional 11.2% |
| Immigrants | Poland | 100.0 /100 | #47 | Exceptional 11.2% |
| Immigrants | Turkey | 100.0 /100 | #48 | Exceptional 11.2% |
| Immigrants | Saudi Arabia | 100.0 /100 | #49 | Exceptional 11.2% |
| Bolivians | 100.0 /100 | #50 | Exceptional 11.2% |
| Immigrants | Bolivia | 100.0 /100 | #51 | Exceptional 11.3% |
| Immigrants | Australia | 99.9 /100 | #52 | Exceptional 11.3% |
| Immigrants | Lithuania | 99.9 /100 | #53 | Exceptional 11.3% |
| Eastern Europeans | 99.9 /100 | #54 | Exceptional 11.3% |
| Immigrants | Yemen | 99.9 /100 | #55 | Exceptional 11.3% |
| Immigrants | Philippines | 99.9 /100 | #56 | Exceptional 11.3% |
| Immigrants | Vietnam | 99.9 /100 | #57 | Exceptional 11.3% |
| Sri Lankans | 99.9 /100 | #58 | Exceptional 11.3% |
| Israelis | 99.9 /100 | #59 | Exceptional 11.3% |
| Immigrants | Russia | 99.9 /100 | #60 | Exceptional 11.3% |
| Koreans | 99.9 /100 | #61 | Exceptional 11.3% |
| Luxembourgers | 99.9 /100 | #62 | Exceptional 11.3% |