Luxembourger vs Bolivian College, Under 1 year
COMPARE
Luxembourger
Bolivian
College, Under 1 year
College, Under 1 year Comparison
Luxembourgers
Bolivians
68.2%
COLLEGE, UNDER 1 YEAR
98.1/ 100
METRIC RATING
92nd/ 347
METRIC RANK
68.7%
COLLEGE, UNDER 1 YEAR
99.0/ 100
METRIC RATING
72nd/ 347
METRIC RANK
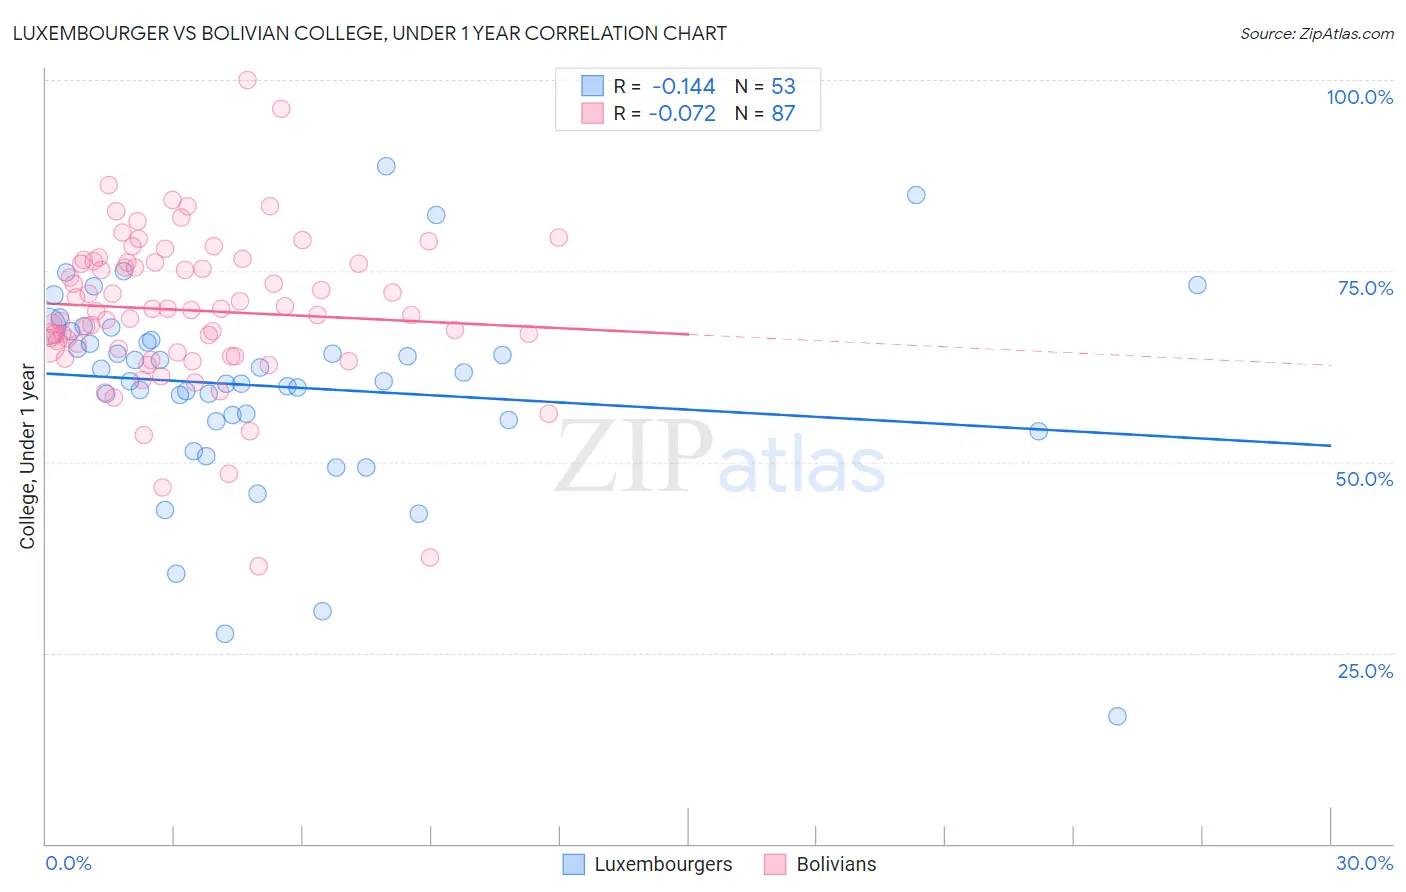
Luxembourger vs Bolivian College, Under 1 year Correlation Chart
The statistical analysis conducted on geographies consisting of 144,676,190 people shows a poor negative correlation between the proportion of Luxembourgers and percentage of population with at least college, under 1 year education in the United States with a correlation coefficient (R) of -0.144 and weighted average of 68.2%. Similarly, the statistical analysis conducted on geographies consisting of 184,667,998 people shows a slight negative correlation between the proportion of Bolivians and percentage of population with at least college, under 1 year education in the United States with a correlation coefficient (R) of -0.072 and weighted average of 68.7%, a difference of 0.72%.
College, Under 1 year Correlation Summary
| Measurement | Luxembourger | Bolivian |
| Minimum | 16.7% | 36.3% |
| Maximum | 88.7% | 100.0% |
| Range | 72.1% | 63.7% |
| Mean | 59.8% | 69.8% |
| Median | 60.6% | 69.8% |
| Interquartile 25% (IQ1) | 55.4% | 64.4% |
| Interquartile 75% (IQ3) | 66.5% | 76.1% |
| Interquartile Range (IQR) | 11.1% | 11.7% |
| Standard Deviation (Sample) | 13.2% | 10.3% |
| Standard Deviation (Population) | 13.1% | 10.3% |
Demographics Similar to Luxembourgers and Bolivians by College, Under 1 year
In terms of college, under 1 year, the demographic groups most similar to Luxembourgers are European (68.2%, a difference of 0.010%), Icelander (68.3%, a difference of 0.040%), Ethiopian (68.3%, a difference of 0.10%), Croatian (68.3%, a difference of 0.11%), and Chinese (68.3%, a difference of 0.12%). Similarly, the demographic groups most similar to Bolivians are Immigrants from England (68.7%, a difference of 0.040%), Swedish (68.7%, a difference of 0.090%), Immigrants from Western Europe (68.5%, a difference of 0.34%), Laotian (68.5%, a difference of 0.34%), and British (68.5%, a difference of 0.38%).
| Demographics | Rating | Rank | College, Under 1 year |
| Bolivians | 99.0 /100 | #72 | Exceptional 68.7% |
| Immigrants | England | 99.0 /100 | #73 | Exceptional 68.7% |
| Swedes | 98.9 /100 | #74 | Exceptional 68.7% |
| Immigrants | Western Europe | 98.6 /100 | #75 | Exceptional 68.5% |
| Laotians | 98.6 /100 | #76 | Exceptional 68.5% |
| British | 98.6 /100 | #77 | Exceptional 68.5% |
| Danes | 98.6 /100 | #78 | Exceptional 68.5% |
| Greeks | 98.6 /100 | #79 | Exceptional 68.5% |
| Immigrants | Spain | 98.5 /100 | #80 | Exceptional 68.4% |
| Immigrants | Greece | 98.5 /100 | #81 | Exceptional 68.4% |
| Norwegians | 98.4 /100 | #82 | Exceptional 68.4% |
| Argentineans | 98.4 /100 | #83 | Exceptional 68.4% |
| Immigrants | Hungary | 98.3 /100 | #84 | Exceptional 68.3% |
| Egyptians | 98.3 /100 | #85 | Exceptional 68.3% |
| Immigrants | Lebanon | 98.3 /100 | #86 | Exceptional 68.3% |
| Chinese | 98.3 /100 | #87 | Exceptional 68.3% |
| Croatians | 98.2 /100 | #88 | Exceptional 68.3% |
| Ethiopians | 98.2 /100 | #89 | Exceptional 68.3% |
| Icelanders | 98.1 /100 | #90 | Exceptional 68.3% |
| Europeans | 98.1 /100 | #91 | Exceptional 68.2% |
| Luxembourgers | 98.1 /100 | #92 | Exceptional 68.2% |