Lumbee vs Tohono O'odham Family Households
COMPARE
Lumbee
Tohono O'odham
Family Households
Family Households Comparison
Lumbee
Tohono O'odham
63.1%
FAMILY HOUSEHOLDS
0.3/ 100
METRIC RATING
274th/ 347
METRIC RANK
67.1%
FAMILY HOUSEHOLDS
100.0/ 100
METRIC RATING
35th/ 347
METRIC RANK
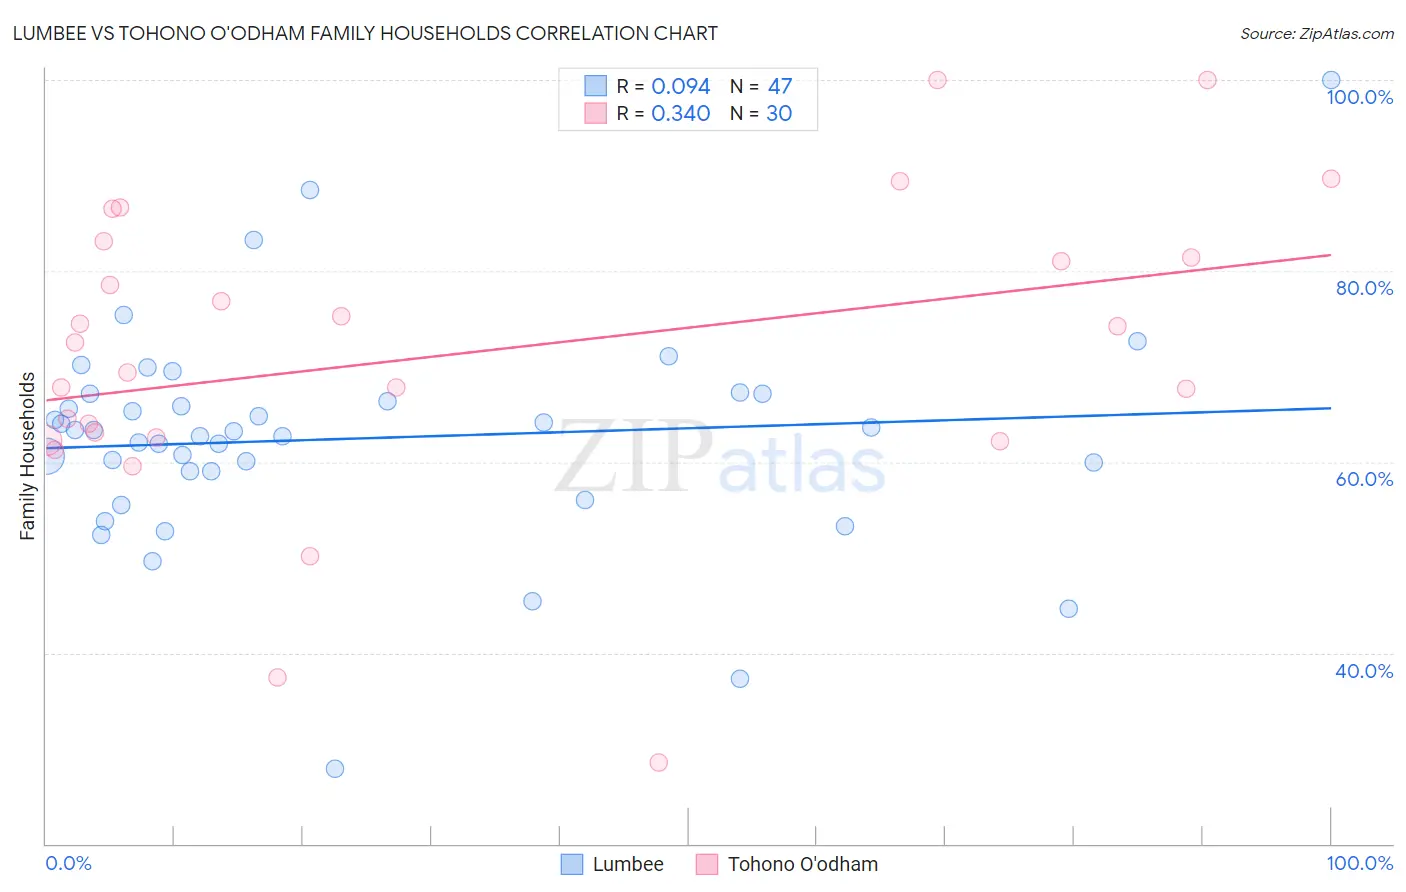
Lumbee vs Tohono O'odham Family Households Correlation Chart
The statistical analysis conducted on geographies consisting of 92,265,071 people shows a slight positive correlation between the proportion of Lumbee and percentage of family households in the United States with a correlation coefficient (R) of 0.094 and weighted average of 63.1%. Similarly, the statistical analysis conducted on geographies consisting of 58,718,905 people shows a mild positive correlation between the proportion of Tohono O'odham and percentage of family households in the United States with a correlation coefficient (R) of 0.340 and weighted average of 67.1%, a difference of 6.5%.
Family Households Correlation Summary
| Measurement | Lumbee | Tohono O'odham |
| Minimum | 27.9% | 28.6% |
| Maximum | 100.0% | 100.0% |
| Range | 72.1% | 71.4% |
| Mean | 62.4% | 71.3% |
| Median | 63.1% | 71.0% |
| Interquartile 25% (IQ1) | 59.0% | 62.6% |
| Interquartile 75% (IQ3) | 67.2% | 81.4% |
| Interquartile Range (IQR) | 8.2% | 18.8% |
| Standard Deviation (Sample) | 11.7% | 15.9% |
| Standard Deviation (Population) | 11.5% | 15.7% |
Similar Demographics by Family Households
Demographics Similar to Lumbee by Family Households
In terms of family households, the demographic groups most similar to Lumbee are West Indian (63.1%, a difference of 0.0%), Immigrants from Kazakhstan (63.1%, a difference of 0.010%), Serbian (63.0%, a difference of 0.010%), Immigrants from Croatia (63.1%, a difference of 0.020%), and Immigrants from Turkey (63.1%, a difference of 0.020%).
| Demographics | Rating | Rank | Family Households |
| Israelis | 0.4 /100 | #267 | Tragic 63.1% |
| Immigrants | Singapore | 0.4 /100 | #268 | Tragic 63.1% |
| Yugoslavians | 0.4 /100 | #269 | Tragic 63.1% |
| Immigrants | Austria | 0.3 /100 | #270 | Tragic 63.1% |
| Immigrants | Croatia | 0.3 /100 | #271 | Tragic 63.1% |
| Immigrants | Turkey | 0.3 /100 | #272 | Tragic 63.1% |
| Immigrants | Kazakhstan | 0.3 /100 | #273 | Tragic 63.1% |
| Lumbee | 0.3 /100 | #274 | Tragic 63.1% |
| West Indians | 0.3 /100 | #275 | Tragic 63.1% |
| Serbians | 0.3 /100 | #276 | Tragic 63.0% |
| Ottawa | 0.3 /100 | #277 | Tragic 63.0% |
| Immigrants | Belgium | 0.2 /100 | #278 | Tragic 63.0% |
| Immigrants | Yemen | 0.2 /100 | #279 | Tragic 63.0% |
| Immigrants | Bulgaria | 0.2 /100 | #280 | Tragic 63.0% |
| Estonians | 0.2 /100 | #281 | Tragic 62.9% |
Demographics Similar to Tohono O'odham by Family Households
In terms of family households, the demographic groups most similar to Tohono O'odham are Peruvian (67.1%, a difference of 0.010%), Salvadoran (67.2%, a difference of 0.050%), Thai (67.2%, a difference of 0.050%), Tsimshian (67.1%, a difference of 0.080%), and Nepalese (67.2%, a difference of 0.090%).
| Demographics | Rating | Rank | Family Households |
| Hawaiians | 100.0 /100 | #28 | Exceptional 67.4% |
| Nicaraguans | 100.0 /100 | #29 | Exceptional 67.4% |
| Immigrants | Peru | 100.0 /100 | #30 | Exceptional 67.2% |
| Immigrants | Latin America | 100.0 /100 | #31 | Exceptional 67.2% |
| Nepalese | 100.0 /100 | #32 | Exceptional 67.2% |
| Salvadorans | 100.0 /100 | #33 | Exceptional 67.2% |
| Thais | 100.0 /100 | #34 | Exceptional 67.2% |
| Tohono O'odham | 100.0 /100 | #35 | Exceptional 67.1% |
| Peruvians | 100.0 /100 | #36 | Exceptional 67.1% |
| Tsimshian | 100.0 /100 | #37 | Exceptional 67.1% |
| Mexican American Indians | 100.0 /100 | #38 | Exceptional 67.0% |
| Immigrants | El Salvador | 100.0 /100 | #39 | Exceptional 67.0% |
| Guamanians/Chamorros | 100.0 /100 | #40 | Exceptional 66.6% |
| Immigrants | Bolivia | 100.0 /100 | #41 | Exceptional 66.6% |
| Menominee | 100.0 /100 | #42 | Exceptional 66.5% |