Lumbee vs English Family Households
COMPARE
Lumbee
English
Family Households
Family Households Comparison
Lumbee
English
63.1%
FAMILY HOUSEHOLDS
0.3/ 100
METRIC RATING
274th/ 347
METRIC RANK
65.1%
FAMILY HOUSEHOLDS
97.4/ 100
METRIC RATING
105th/ 347
METRIC RANK
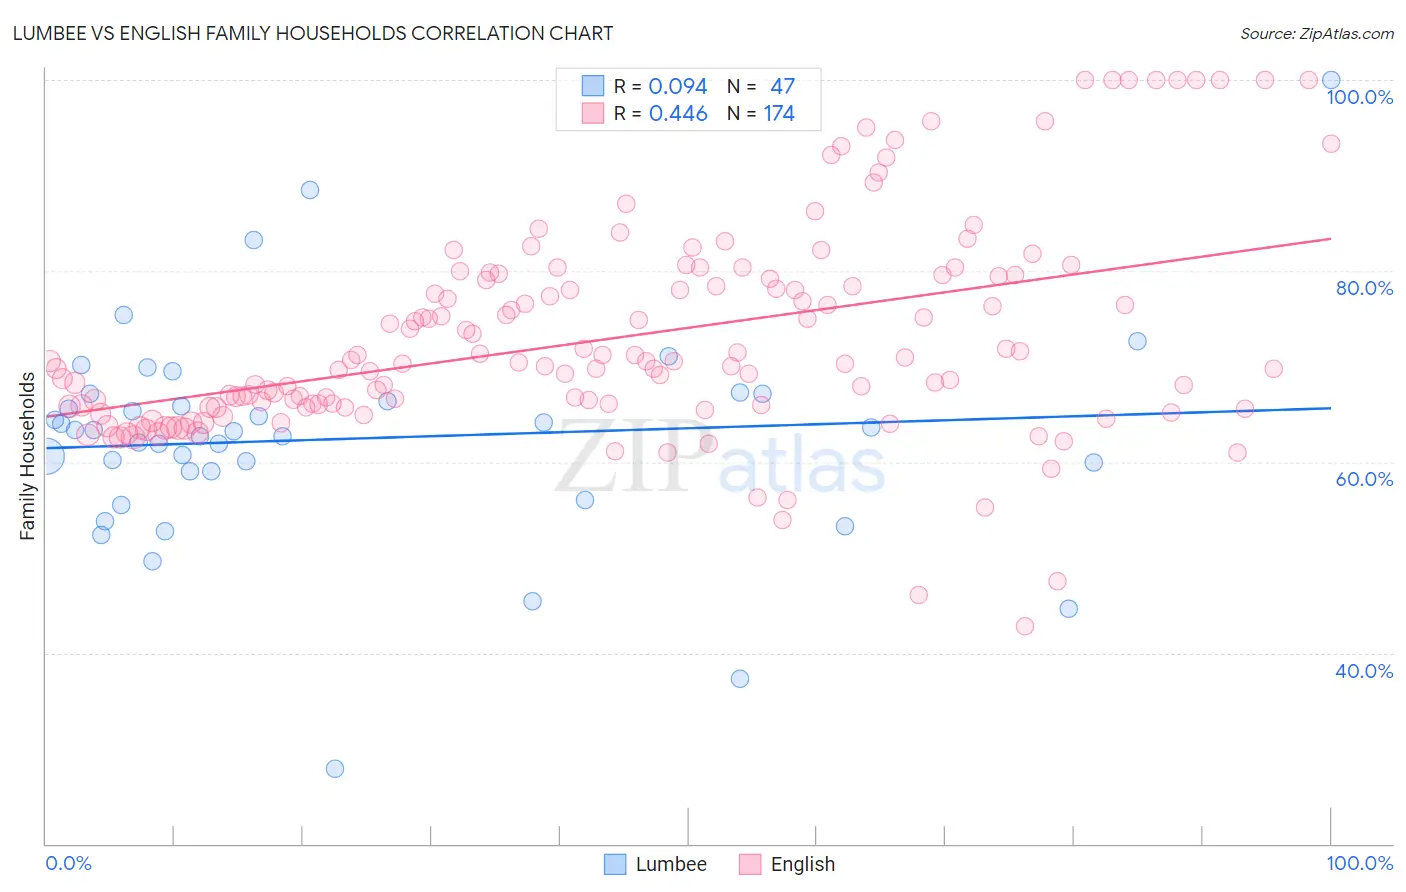
Lumbee vs English Family Households Correlation Chart
The statistical analysis conducted on geographies consisting of 92,265,071 people shows a slight positive correlation between the proportion of Lumbee and percentage of family households in the United States with a correlation coefficient (R) of 0.094 and weighted average of 63.1%. Similarly, the statistical analysis conducted on geographies consisting of 579,316,298 people shows a moderate positive correlation between the proportion of English and percentage of family households in the United States with a correlation coefficient (R) of 0.446 and weighted average of 65.1%, a difference of 3.2%.
Family Households Correlation Summary
| Measurement | Lumbee | English |
| Minimum | 27.9% | 42.7% |
| Maximum | 100.0% | 100.0% |
| Range | 72.1% | 57.3% |
| Mean | 62.4% | 73.0% |
| Median | 63.1% | 70.3% |
| Interquartile 25% (IQ1) | 59.0% | 65.8% |
| Interquartile 75% (IQ3) | 67.2% | 79.2% |
| Interquartile Range (IQR) | 8.2% | 13.5% |
| Standard Deviation (Sample) | 11.7% | 11.1% |
| Standard Deviation (Population) | 11.5% | 11.0% |
Similar Demographics by Family Households
Demographics Similar to Lumbee by Family Households
In terms of family households, the demographic groups most similar to Lumbee are West Indian (63.1%, a difference of 0.0%), Immigrants from Kazakhstan (63.1%, a difference of 0.010%), Serbian (63.0%, a difference of 0.010%), Immigrants from Croatia (63.1%, a difference of 0.020%), and Immigrants from Turkey (63.1%, a difference of 0.020%).
| Demographics | Rating | Rank | Family Households |
| Israelis | 0.4 /100 | #267 | Tragic 63.1% |
| Immigrants | Singapore | 0.4 /100 | #268 | Tragic 63.1% |
| Yugoslavians | 0.4 /100 | #269 | Tragic 63.1% |
| Immigrants | Austria | 0.3 /100 | #270 | Tragic 63.1% |
| Immigrants | Croatia | 0.3 /100 | #271 | Tragic 63.1% |
| Immigrants | Turkey | 0.3 /100 | #272 | Tragic 63.1% |
| Immigrants | Kazakhstan | 0.3 /100 | #273 | Tragic 63.1% |
| Lumbee | 0.3 /100 | #274 | Tragic 63.1% |
| West Indians | 0.3 /100 | #275 | Tragic 63.1% |
| Serbians | 0.3 /100 | #276 | Tragic 63.0% |
| Ottawa | 0.3 /100 | #277 | Tragic 63.0% |
| Immigrants | Belgium | 0.2 /100 | #278 | Tragic 63.0% |
| Immigrants | Yemen | 0.2 /100 | #279 | Tragic 63.0% |
| Immigrants | Bulgaria | 0.2 /100 | #280 | Tragic 63.0% |
| Estonians | 0.2 /100 | #281 | Tragic 62.9% |
Demographics Similar to English by Family Households
In terms of family households, the demographic groups most similar to English are White/Caucasian (65.1%, a difference of 0.010%), Alaska Native (65.1%, a difference of 0.010%), Palestinian (65.1%, a difference of 0.020%), Immigrants from Guatemala (65.0%, a difference of 0.060%), and Indian (Asian) (65.1%, a difference of 0.070%).
| Demographics | Rating | Rank | Family Households |
| Immigrants | Syria | 98.4 /100 | #98 | Exceptional 65.2% |
| Central American Indians | 98.3 /100 | #99 | Exceptional 65.2% |
| Haitians | 98.1 /100 | #100 | Exceptional 65.2% |
| Chileans | 98.1 /100 | #101 | Exceptional 65.2% |
| Immigrants | Sri Lanka | 98.0 /100 | #102 | Exceptional 65.1% |
| Indians (Asian) | 97.9 /100 | #103 | Exceptional 65.1% |
| Spaniards | 97.8 /100 | #104 | Exceptional 65.1% |
| English | 97.4 /100 | #105 | Exceptional 65.1% |
| Whites/Caucasians | 97.3 /100 | #106 | Exceptional 65.1% |
| Alaska Natives | 97.3 /100 | #107 | Exceptional 65.1% |
| Palestinians | 97.2 /100 | #108 | Exceptional 65.1% |
| Immigrants | Guatemala | 96.9 /100 | #109 | Exceptional 65.0% |
| Scandinavians | 96.8 /100 | #110 | Exceptional 65.0% |
| Europeans | 96.8 /100 | #111 | Exceptional 65.0% |
| Immigrants | Jordan | 96.5 /100 | #112 | Exceptional 65.0% |