Lumbee vs Tohono O'odham 6th Grade
COMPARE
Lumbee
Tohono O'odham
6th Grade
6th Grade Comparison
Lumbee
Tohono O'odham
97.6%
6TH GRADE
99.2/ 100
METRIC RATING
81st/ 347
METRIC RANK
96.5%
6TH GRADE
1.0/ 100
METRIC RATING
248th/ 347
METRIC RANK
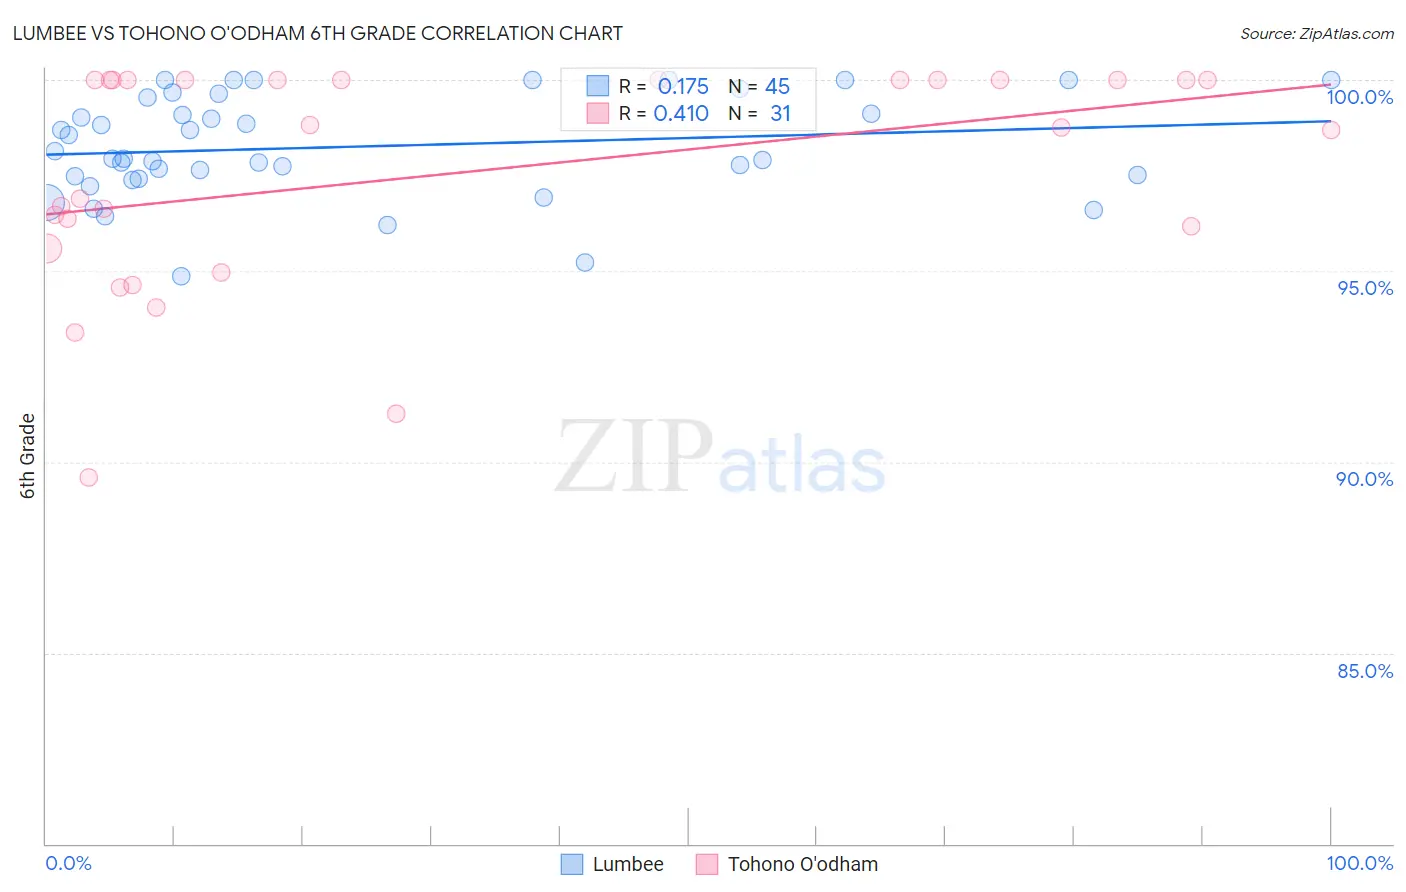
Lumbee vs Tohono O'odham 6th Grade Correlation Chart
The statistical analysis conducted on geographies consisting of 92,298,549 people shows a poor positive correlation between the proportion of Lumbee and percentage of population with at least 6th grade education in the United States with a correlation coefficient (R) of 0.175 and weighted average of 97.6%. Similarly, the statistical analysis conducted on geographies consisting of 58,730,615 people shows a moderate positive correlation between the proportion of Tohono O'odham and percentage of population with at least 6th grade education in the United States with a correlation coefficient (R) of 0.410 and weighted average of 96.5%, a difference of 1.1%.
6th Grade Correlation Summary
| Measurement | Lumbee | Tohono O'odham |
| Minimum | 94.9% | 89.6% |
| Maximum | 100.0% | 100.0% |
| Range | 5.1% | 10.4% |
| Mean | 98.3% | 97.5% |
| Median | 97.9% | 98.8% |
| Interquartile 25% (IQ1) | 97.5% | 95.6% |
| Interquartile 75% (IQ3) | 99.6% | 100.0% |
| Interquartile Range (IQR) | 2.1% | 4.4% |
| Standard Deviation (Sample) | 1.3% | 2.9% |
| Standard Deviation (Population) | 1.3% | 2.9% |
Similar Demographics by 6th Grade
Demographics Similar to Lumbee by 6th Grade
In terms of 6th grade, the demographic groups most similar to Lumbee are Zimbabwean (97.6%, a difference of 0.0%), Osage (97.6%, a difference of 0.010%), Potawatomi (97.6%, a difference of 0.010%), Immigrants from Lithuania (97.6%, a difference of 0.020%), and Icelander (97.6%, a difference of 0.020%).
| Demographics | Rating | Rank | 6th Grade |
| Immigrants | Netherlands | 99.4 /100 | #74 | Exceptional 97.6% |
| Ukrainians | 99.4 /100 | #75 | Exceptional 97.6% |
| Immigrants | England | 99.4 /100 | #76 | Exceptional 97.6% |
| Immigrants | Lithuania | 99.3 /100 | #77 | Exceptional 97.6% |
| Icelanders | 99.3 /100 | #78 | Exceptional 97.6% |
| Immigrants | India | 99.3 /100 | #79 | Exceptional 97.6% |
| Osage | 99.3 /100 | #80 | Exceptional 97.6% |
| Lumbee | 99.2 /100 | #81 | Exceptional 97.6% |
| Zimbabweans | 99.1 /100 | #82 | Exceptional 97.6% |
| Potawatomi | 99.1 /100 | #83 | Exceptional 97.6% |
| Shoshone | 99.0 /100 | #84 | Exceptional 97.6% |
| Delaware | 98.9 /100 | #85 | Exceptional 97.6% |
| Immigrants | Belgium | 98.9 /100 | #86 | Exceptional 97.5% |
| Puget Sound Salish | 98.9 /100 | #87 | Exceptional 97.5% |
| Immigrants | South Africa | 98.9 /100 | #88 | Exceptional 97.5% |
Demographics Similar to Tohono O'odham by 6th Grade
In terms of 6th grade, the demographic groups most similar to Tohono O'odham are Bolivian (96.5%, a difference of 0.0%), Colombian (96.5%, a difference of 0.0%), Immigrants from Middle Africa (96.5%, a difference of 0.020%), Immigrants from Costa Rica (96.6%, a difference of 0.040%), and Immigrants from Africa (96.6%, a difference of 0.040%).
| Demographics | Rating | Rank | 6th Grade |
| Senegalese | 1.8 /100 | #241 | Tragic 96.6% |
| Immigrants | Asia | 1.8 /100 | #242 | Tragic 96.6% |
| Immigrants | Liberia | 1.6 /100 | #243 | Tragic 96.6% |
| Ethiopians | 1.5 /100 | #244 | Tragic 96.6% |
| Immigrants | Costa Rica | 1.3 /100 | #245 | Tragic 96.6% |
| Immigrants | Africa | 1.3 /100 | #246 | Tragic 96.6% |
| Bolivians | 1.0 /100 | #247 | Tragic 96.5% |
| Tohono O'odham | 1.0 /100 | #248 | Tragic 96.5% |
| Colombians | 0.9 /100 | #249 | Tragic 96.5% |
| Immigrants | Middle Africa | 0.8 /100 | #250 | Tragic 96.5% |
| Immigrants | Senegal | 0.7 /100 | #251 | Tragic 96.5% |
| Immigrants | Uruguay | 0.6 /100 | #252 | Tragic 96.5% |
| Jamaicans | 0.6 /100 | #253 | Tragic 96.5% |
| Immigrants | Ethiopia | 0.6 /100 | #254 | Tragic 96.5% |
| Immigrants | Congo | 0.6 /100 | #255 | Tragic 96.5% |