Lithuanian vs Laotian Currently Married
COMPARE
Lithuanian
Laotian
Currently Married
Currently Married Comparison
Lithuanians
Laotians
49.0%
CURRENTLY MARRIED
99.6/ 100
METRIC RATING
24th/ 347
METRIC RANK
47.4%
CURRENTLY MARRIED
86.6/ 100
METRIC RATING
124th/ 347
METRIC RANK
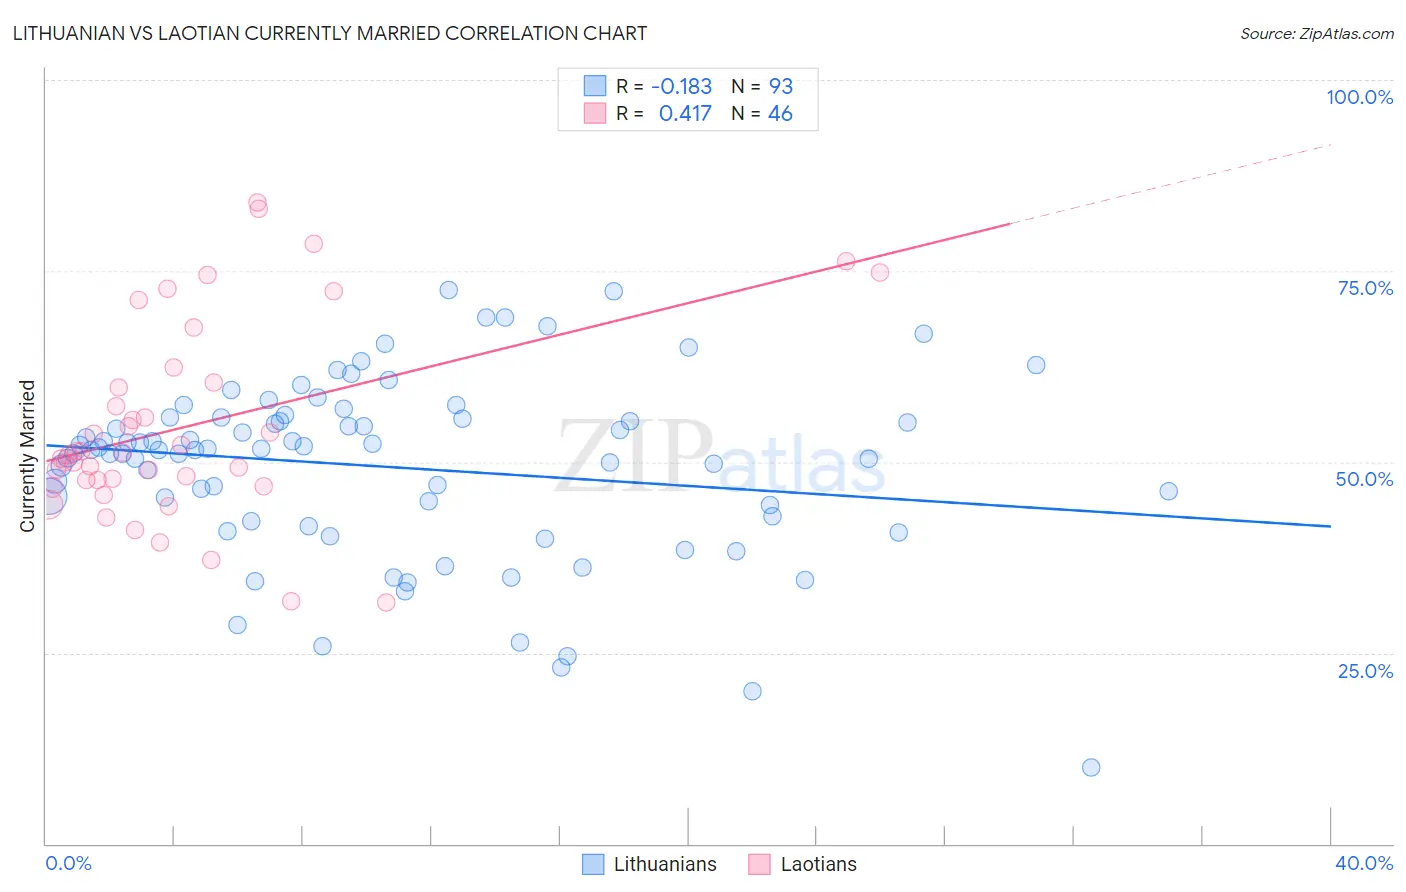
Lithuanian vs Laotian Currently Married Correlation Chart
The statistical analysis conducted on geographies consisting of 421,888,546 people shows a poor negative correlation between the proportion of Lithuanians and percentage of population currently married in the United States with a correlation coefficient (R) of -0.183 and weighted average of 49.0%. Similarly, the statistical analysis conducted on geographies consisting of 224,816,761 people shows a moderate positive correlation between the proportion of Laotians and percentage of population currently married in the United States with a correlation coefficient (R) of 0.417 and weighted average of 47.4%, a difference of 3.3%.
Currently Married Correlation Summary
| Measurement | Lithuanian | Laotian |
| Minimum | 10.0% | 31.6% |
| Maximum | 72.5% | 83.9% |
| Range | 62.5% | 52.3% |
| Mean | 49.3% | 54.7% |
| Median | 51.6% | 51.1% |
| Interquartile 25% (IQ1) | 42.6% | 47.6% |
| Interquartile 75% (IQ3) | 55.8% | 60.4% |
| Interquartile Range (IQR) | 13.2% | 12.7% |
| Standard Deviation (Sample) | 11.7% | 12.9% |
| Standard Deviation (Population) | 11.7% | 12.8% |
Similar Demographics by Currently Married
Demographics Similar to Lithuanians by Currently Married
In terms of currently married, the demographic groups most similar to Lithuanians are Maltese (49.0%, a difference of 0.010%), Immigrants from Korea (49.0%, a difference of 0.060%), Immigrants from Pakistan (49.1%, a difference of 0.11%), Burmese (48.9%, a difference of 0.13%), and Welsh (48.9%, a difference of 0.17%).
| Demographics | Rating | Rank | Currently Married |
| Scandinavians | 99.9 /100 | #17 | Exceptional 49.5% |
| Immigrants | Scotland | 99.8 /100 | #18 | Exceptional 49.3% |
| Europeans | 99.8 /100 | #19 | Exceptional 49.3% |
| Luxembourgers | 99.8 /100 | #20 | Exceptional 49.3% |
| Scottish | 99.8 /100 | #21 | Exceptional 49.2% |
| Bulgarians | 99.7 /100 | #22 | Exceptional 49.1% |
| Immigrants | Pakistan | 99.7 /100 | #23 | Exceptional 49.1% |
| Lithuanians | 99.6 /100 | #24 | Exceptional 49.0% |
| Maltese | 99.6 /100 | #25 | Exceptional 49.0% |
| Immigrants | Korea | 99.6 /100 | #26 | Exceptional 49.0% |
| Burmese | 99.6 /100 | #27 | Exceptional 48.9% |
| Welsh | 99.5 /100 | #28 | Exceptional 48.9% |
| Croatians | 99.5 /100 | #29 | Exceptional 48.9% |
| Eastern Europeans | 99.5 /100 | #30 | Exceptional 48.9% |
| Poles | 99.5 /100 | #31 | Exceptional 48.9% |
Demographics Similar to Laotians by Currently Married
In terms of currently married, the demographic groups most similar to Laotians are Immigrants from Kazakhstan (47.4%, a difference of 0.050%), Okinawan (47.4%, a difference of 0.10%), Osage (47.5%, a difference of 0.11%), Immigrants from Jordan (47.4%, a difference of 0.13%), and New Zealander (47.4%, a difference of 0.13%).
| Demographics | Rating | Rank | Currently Married |
| Puget Sound Salish | 90.3 /100 | #117 | Exceptional 47.6% |
| Immigrants | Philippines | 90.2 /100 | #118 | Exceptional 47.6% |
| Australians | 90.2 /100 | #119 | Exceptional 47.6% |
| Syrians | 88.9 /100 | #120 | Excellent 47.5% |
| Immigrants | Croatia | 88.6 /100 | #121 | Excellent 47.5% |
| Osage | 87.9 /100 | #122 | Excellent 47.5% |
| Immigrants | Kazakhstan | 87.2 /100 | #123 | Excellent 47.4% |
| Laotians | 86.6 /100 | #124 | Excellent 47.4% |
| Okinawans | 85.3 /100 | #125 | Excellent 47.4% |
| Immigrants | Jordan | 84.9 /100 | #126 | Excellent 47.4% |
| New Zealanders | 84.9 /100 | #127 | Excellent 47.4% |
| Portuguese | 84.2 /100 | #128 | Excellent 47.3% |
| Sri Lankans | 83.2 /100 | #129 | Excellent 47.3% |
| Immigrants | Iraq | 82.8 /100 | #130 | Excellent 47.3% |
| Icelanders | 82.4 /100 | #131 | Excellent 47.3% |