Lithuanian vs French Canadian Currently Married
COMPARE
Lithuanian
French Canadian
Currently Married
Currently Married Comparison
Lithuanians
French Canadians
49.0%
CURRENTLY MARRIED
99.6/ 100
METRIC RATING
24th/ 347
METRIC RANK
48.0%
CURRENTLY MARRIED
96.3/ 100
METRIC RATING
85th/ 347
METRIC RANK
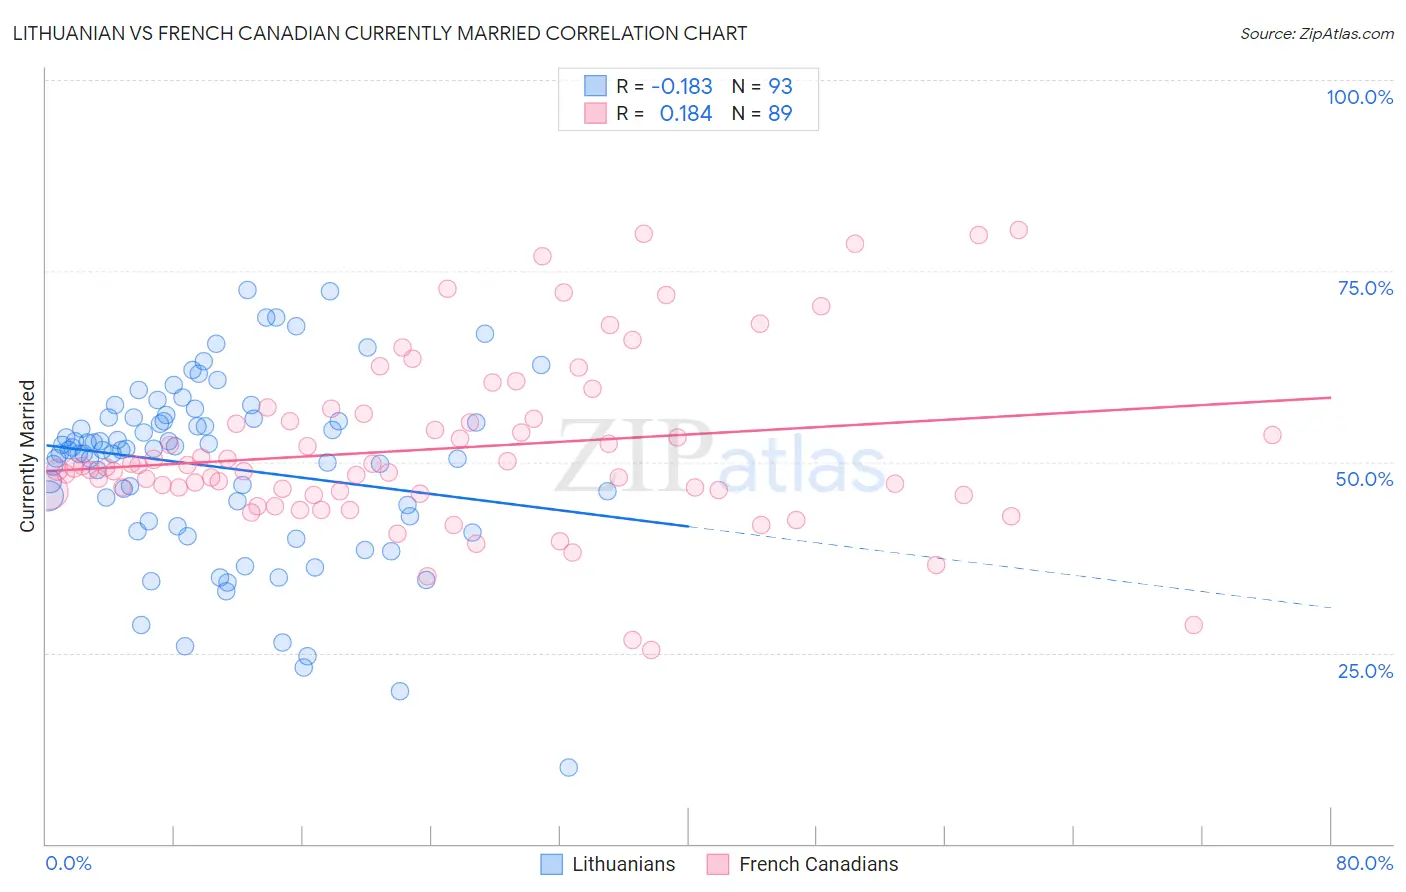
Lithuanian vs French Canadian Currently Married Correlation Chart
The statistical analysis conducted on geographies consisting of 421,888,546 people shows a poor negative correlation between the proportion of Lithuanians and percentage of population currently married in the United States with a correlation coefficient (R) of -0.183 and weighted average of 49.0%. Similarly, the statistical analysis conducted on geographies consisting of 502,604,135 people shows a poor positive correlation between the proportion of French Canadians and percentage of population currently married in the United States with a correlation coefficient (R) of 0.184 and weighted average of 48.0%, a difference of 2.1%.
Currently Married Correlation Summary
| Measurement | Lithuanian | French Canadian |
| Minimum | 10.0% | 25.4% |
| Maximum | 72.5% | 80.4% |
| Range | 62.5% | 55.0% |
| Mean | 49.3% | 51.8% |
| Median | 51.6% | 49.2% |
| Interquartile 25% (IQ1) | 42.6% | 46.0% |
| Interquartile 75% (IQ3) | 55.8% | 55.9% |
| Interquartile Range (IQR) | 13.2% | 9.9% |
| Standard Deviation (Sample) | 11.7% | 11.3% |
| Standard Deviation (Population) | 11.7% | 11.3% |
Similar Demographics by Currently Married
Demographics Similar to Lithuanians by Currently Married
In terms of currently married, the demographic groups most similar to Lithuanians are Maltese (49.0%, a difference of 0.010%), Immigrants from Korea (49.0%, a difference of 0.060%), Immigrants from Pakistan (49.1%, a difference of 0.11%), Burmese (48.9%, a difference of 0.13%), and Welsh (48.9%, a difference of 0.17%).
| Demographics | Rating | Rank | Currently Married |
| Scandinavians | 99.9 /100 | #17 | Exceptional 49.5% |
| Immigrants | Scotland | 99.8 /100 | #18 | Exceptional 49.3% |
| Europeans | 99.8 /100 | #19 | Exceptional 49.3% |
| Luxembourgers | 99.8 /100 | #20 | Exceptional 49.3% |
| Scottish | 99.8 /100 | #21 | Exceptional 49.2% |
| Bulgarians | 99.7 /100 | #22 | Exceptional 49.1% |
| Immigrants | Pakistan | 99.7 /100 | #23 | Exceptional 49.1% |
| Lithuanians | 99.6 /100 | #24 | Exceptional 49.0% |
| Maltese | 99.6 /100 | #25 | Exceptional 49.0% |
| Immigrants | Korea | 99.6 /100 | #26 | Exceptional 49.0% |
| Burmese | 99.6 /100 | #27 | Exceptional 48.9% |
| Welsh | 99.5 /100 | #28 | Exceptional 48.9% |
| Croatians | 99.5 /100 | #29 | Exceptional 48.9% |
| Eastern Europeans | 99.5 /100 | #30 | Exceptional 48.9% |
| Poles | 99.5 /100 | #31 | Exceptional 48.9% |
Demographics Similar to French Canadians by Currently Married
In terms of currently married, the demographic groups most similar to French Canadians are Immigrants from Japan (48.0%, a difference of 0.030%), Jordanian (48.0%, a difference of 0.040%), Immigrants from Eastern Europe (48.0%, a difference of 0.060%), Indian (Asian) (48.0%, a difference of 0.12%), and Bolivian (48.1%, a difference of 0.14%).
| Demographics | Rating | Rank | Currently Married |
| Immigrants | Belgium | 97.1 /100 | #78 | Exceptional 48.1% |
| Immigrants | South Africa | 97.0 /100 | #79 | Exceptional 48.1% |
| Immigrants | Poland | 96.9 /100 | #80 | Exceptional 48.1% |
| Immigrants | Sri Lanka | 96.9 /100 | #81 | Exceptional 48.1% |
| Immigrants | Europe | 96.9 /100 | #82 | Exceptional 48.1% |
| Bolivians | 96.9 /100 | #83 | Exceptional 48.1% |
| Immigrants | Israel | 96.9 /100 | #84 | Exceptional 48.1% |
| French Canadians | 96.3 /100 | #85 | Exceptional 48.0% |
| Immigrants | Japan | 96.2 /100 | #86 | Exceptional 48.0% |
| Jordanians | 96.2 /100 | #87 | Exceptional 48.0% |
| Immigrants | Eastern Europe | 96.1 /100 | #88 | Exceptional 48.0% |
| Indians (Asian) | 95.8 /100 | #89 | Exceptional 48.0% |
| Americans | 95.7 /100 | #90 | Exceptional 48.0% |
| Immigrants | Bolivia | 95.6 /100 | #91 | Exceptional 47.9% |
| Koreans | 95.4 /100 | #92 | Exceptional 47.9% |