Immigrants from Syria vs Laotian Currently Married
COMPARE
Immigrants from Syria
Laotian
Currently Married
Currently Married Comparison
Immigrants from Syria
Laotians
46.8%
CURRENTLY MARRIED
59.3/ 100
METRIC RATING
166th/ 347
METRIC RANK
47.4%
CURRENTLY MARRIED
86.6/ 100
METRIC RATING
124th/ 347
METRIC RANK
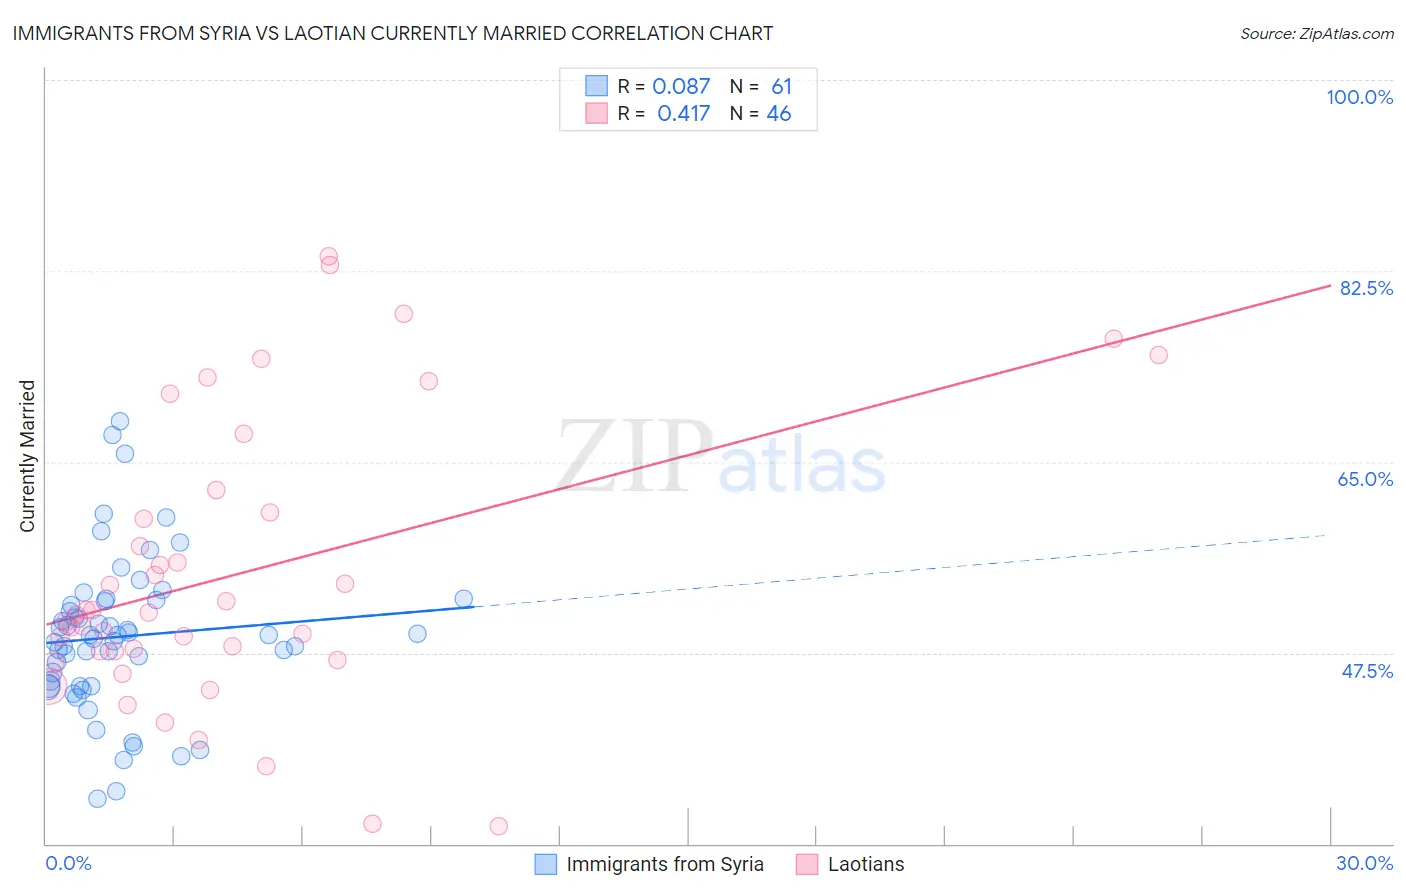
Immigrants from Syria vs Laotian Currently Married Correlation Chart
The statistical analysis conducted on geographies consisting of 174,114,575 people shows a slight positive correlation between the proportion of Immigrants from Syria and percentage of population currently married in the United States with a correlation coefficient (R) of 0.087 and weighted average of 46.8%. Similarly, the statistical analysis conducted on geographies consisting of 224,816,761 people shows a moderate positive correlation between the proportion of Laotians and percentage of population currently married in the United States with a correlation coefficient (R) of 0.417 and weighted average of 47.4%, a difference of 1.4%.
Currently Married Correlation Summary
| Measurement | Immigrants from Syria | Laotian |
| Minimum | 34.1% | 31.6% |
| Maximum | 68.7% | 83.9% |
| Range | 34.6% | 52.3% |
| Mean | 49.0% | 54.7% |
| Median | 49.1% | 51.1% |
| Interquartile 25% (IQ1) | 44.5% | 47.6% |
| Interquartile 75% (IQ3) | 52.2% | 60.4% |
| Interquartile Range (IQR) | 7.8% | 12.7% |
| Standard Deviation (Sample) | 7.0% | 12.9% |
| Standard Deviation (Population) | 7.0% | 12.8% |
Similar Demographics by Currently Married
Demographics Similar to Immigrants from Syria by Currently Married
In terms of currently married, the demographic groups most similar to Immigrants from Syria are Samoan (46.8%, a difference of 0.020%), Spaniard (46.8%, a difference of 0.020%), Immigrants from Afghanistan (46.8%, a difference of 0.040%), Armenian (46.8%, a difference of 0.040%), and Immigrants from Latvia (46.7%, a difference of 0.10%).
| Demographics | Rating | Rank | Currently Married |
| Iraqis | 66.4 /100 | #159 | Good 46.9% |
| Immigrants | Uzbekistan | 66.0 /100 | #160 | Good 46.9% |
| Immigrants | Southern Europe | 65.9 /100 | #161 | Good 46.9% |
| Immigrants | Nonimmigrants | 65.4 /100 | #162 | Good 46.9% |
| Delaware | 64.7 /100 | #163 | Good 46.9% |
| Immigrants | Western Asia | 64.2 /100 | #164 | Good 46.9% |
| Samoans | 59.8 /100 | #165 | Average 46.8% |
| Immigrants | Syria | 59.3 /100 | #166 | Average 46.8% |
| Spaniards | 58.8 /100 | #167 | Average 46.8% |
| Immigrants | Afghanistan | 58.2 /100 | #168 | Average 46.8% |
| Armenians | 58.2 /100 | #169 | Average 46.8% |
| Immigrants | Latvia | 56.7 /100 | #170 | Average 46.7% |
| Immigrants | Zimbabwe | 52.4 /100 | #171 | Average 46.7% |
| Aleuts | 52.0 /100 | #172 | Average 46.7% |
| Tlingit-Haida | 51.2 /100 | #173 | Average 46.7% |
Demographics Similar to Laotians by Currently Married
In terms of currently married, the demographic groups most similar to Laotians are Immigrants from Kazakhstan (47.4%, a difference of 0.050%), Okinawan (47.4%, a difference of 0.10%), Osage (47.5%, a difference of 0.11%), Immigrants from Jordan (47.4%, a difference of 0.13%), and New Zealander (47.4%, a difference of 0.13%).
| Demographics | Rating | Rank | Currently Married |
| Puget Sound Salish | 90.3 /100 | #117 | Exceptional 47.6% |
| Immigrants | Philippines | 90.2 /100 | #118 | Exceptional 47.6% |
| Australians | 90.2 /100 | #119 | Exceptional 47.6% |
| Syrians | 88.9 /100 | #120 | Excellent 47.5% |
| Immigrants | Croatia | 88.6 /100 | #121 | Excellent 47.5% |
| Osage | 87.9 /100 | #122 | Excellent 47.5% |
| Immigrants | Kazakhstan | 87.2 /100 | #123 | Excellent 47.4% |
| Laotians | 86.6 /100 | #124 | Excellent 47.4% |
| Okinawans | 85.3 /100 | #125 | Excellent 47.4% |
| Immigrants | Jordan | 84.9 /100 | #126 | Excellent 47.4% |
| New Zealanders | 84.9 /100 | #127 | Excellent 47.4% |
| Portuguese | 84.2 /100 | #128 | Excellent 47.3% |
| Sri Lankans | 83.2 /100 | #129 | Excellent 47.3% |
| Immigrants | Iraq | 82.8 /100 | #130 | Excellent 47.3% |
| Icelanders | 82.4 /100 | #131 | Excellent 47.3% |