Immigrants from West Indies vs Laotian Currently Married
COMPARE
Immigrants from West Indies
Laotian
Currently Married
Currently Married Comparison
Immigrants from West Indies
Laotians
40.7%
CURRENTLY MARRIED
0.0/ 100
METRIC RATING
323rd/ 347
METRIC RANK
47.4%
CURRENTLY MARRIED
86.6/ 100
METRIC RATING
124th/ 347
METRIC RANK
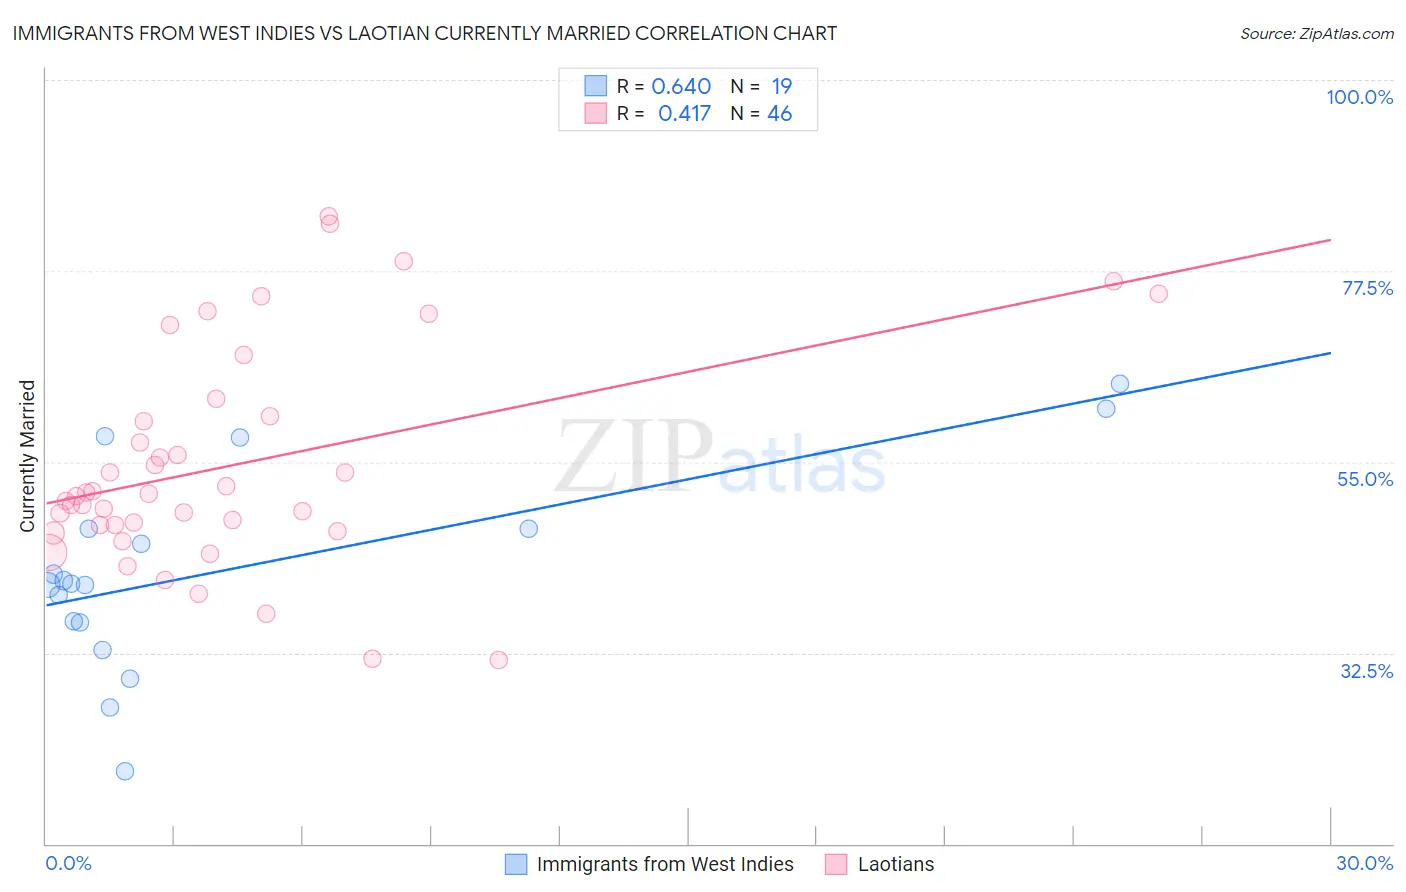
Immigrants from West Indies vs Laotian Currently Married Correlation Chart
The statistical analysis conducted on geographies consisting of 72,457,514 people shows a significant positive correlation between the proportion of Immigrants from West Indies and percentage of population currently married in the United States with a correlation coefficient (R) of 0.640 and weighted average of 40.7%. Similarly, the statistical analysis conducted on geographies consisting of 224,816,761 people shows a moderate positive correlation between the proportion of Laotians and percentage of population currently married in the United States with a correlation coefficient (R) of 0.417 and weighted average of 47.4%, a difference of 16.5%.
Currently Married Correlation Summary
| Measurement | Immigrants from West Indies | Laotian |
| Minimum | 18.5% | 31.6% |
| Maximum | 64.2% | 83.9% |
| Range | 45.7% | 52.3% |
| Mean | 42.3% | 54.7% |
| Median | 40.6% | 51.1% |
| Interquartile 25% (IQ1) | 36.1% | 47.6% |
| Interquartile 75% (IQ3) | 47.1% | 60.4% |
| Interquartile Range (IQR) | 11.0% | 12.7% |
| Standard Deviation (Sample) | 11.9% | 12.9% |
| Standard Deviation (Population) | 11.6% | 12.8% |
Similar Demographics by Currently Married
Demographics Similar to Immigrants from West Indies by Currently Married
In terms of currently married, the demographic groups most similar to Immigrants from West Indies are Immigrants from Senegal (40.7%, a difference of 0.010%), U.S. Virgin Islander (40.7%, a difference of 0.060%), Barbadian (40.6%, a difference of 0.20%), Senegalese (40.6%, a difference of 0.37%), and Arapaho (40.5%, a difference of 0.41%).
| Demographics | Rating | Rank | Currently Married |
| Immigrants | Caribbean | 0.0 /100 | #316 | Tragic 41.3% |
| Haitians | 0.0 /100 | #317 | Tragic 41.3% |
| Bahamians | 0.0 /100 | #318 | Tragic 41.2% |
| Immigrants | Somalia | 0.0 /100 | #319 | Tragic 41.2% |
| Immigrants | Jamaica | 0.0 /100 | #320 | Tragic 41.1% |
| Immigrants | Congo | 0.0 /100 | #321 | Tragic 41.1% |
| Immigrants | Haiti | 0.0 /100 | #322 | Tragic 41.0% |
| Immigrants | West Indies | 0.0 /100 | #323 | Tragic 40.7% |
| Immigrants | Senegal | 0.0 /100 | #324 | Tragic 40.7% |
| U.S. Virgin Islanders | 0.0 /100 | #325 | Tragic 40.7% |
| Barbadians | 0.0 /100 | #326 | Tragic 40.6% |
| Senegalese | 0.0 /100 | #327 | Tragic 40.6% |
| Arapaho | 0.0 /100 | #328 | Tragic 40.5% |
| Crow | 0.0 /100 | #329 | Tragic 40.4% |
| Immigrants | Dominica | 0.0 /100 | #330 | Tragic 40.3% |
Demographics Similar to Laotians by Currently Married
In terms of currently married, the demographic groups most similar to Laotians are Immigrants from Kazakhstan (47.4%, a difference of 0.050%), Okinawan (47.4%, a difference of 0.10%), Osage (47.5%, a difference of 0.11%), Immigrants from Jordan (47.4%, a difference of 0.13%), and New Zealander (47.4%, a difference of 0.13%).
| Demographics | Rating | Rank | Currently Married |
| Puget Sound Salish | 90.3 /100 | #117 | Exceptional 47.6% |
| Immigrants | Philippines | 90.2 /100 | #118 | Exceptional 47.6% |
| Australians | 90.2 /100 | #119 | Exceptional 47.6% |
| Syrians | 88.9 /100 | #120 | Excellent 47.5% |
| Immigrants | Croatia | 88.6 /100 | #121 | Excellent 47.5% |
| Osage | 87.9 /100 | #122 | Excellent 47.5% |
| Immigrants | Kazakhstan | 87.2 /100 | #123 | Excellent 47.4% |
| Laotians | 86.6 /100 | #124 | Excellent 47.4% |
| Okinawans | 85.3 /100 | #125 | Excellent 47.4% |
| Immigrants | Jordan | 84.9 /100 | #126 | Excellent 47.4% |
| New Zealanders | 84.9 /100 | #127 | Excellent 47.4% |
| Portuguese | 84.2 /100 | #128 | Excellent 47.3% |
| Sri Lankans | 83.2 /100 | #129 | Excellent 47.3% |
| Immigrants | Iraq | 82.8 /100 | #130 | Excellent 47.3% |
| Icelanders | 82.4 /100 | #131 | Excellent 47.3% |