Liberian vs Immigrants from El Salvador Family Households

COMPARE

Liberian
Race
Ancestry
AfghanAfricanAlaska NativeAlaskan AthabascanAlbanianAleutAlsatianAmericanApacheArabArapahoArgentineanArmenianAssyrian/Chaldean/SyriacAustralianAustrianBahamianBangladeshiBarbadianBasqueBelgianBelizeanBermudanBhutaneseBlackfeetBolivianBrazilianBritishBritish West IndianBulgarianBurmeseCajunCambodianCanadianCape VerdeanCarpatho RusynCelticCentral AmericanCentral American IndianCherokeeCheyenneChickasawChileanChineseChippewaChoctawColombianColvilleComancheCosta RicanCreeCreekCroatianCrowCubanCypriotCzechCzechoslovakianDanishDelawareDominicanDutchDutch West IndianEastern EuropeanEcuadorianEgyptianEnglishEstonianEthiopianEuropeanFijianFilipinoFinnishFrenchFrench American IndianFrench CanadianGermanGerman RussianGhanaianGreekGuamanian/ChamorroGuatemalanGuyaneseHaitianHmongHonduranHopiHoumaHungarianIcelanderIndian (Asian)IndonesianInupiatIranianIraqiIrishIroquoisIsraeliItalianJamaicanJapaneseJordanianKenyanKiowaKoreanLaotianLatvianLebaneseLiberianLithuanianLumbeeLuxembourgerMacedonianMalaysianMalteseMarshalleseMenomineeMexicanMexican American IndianMongolianMoroccanNative HawaiianNavajoNepaleseNew ZealanderNicaraguanNigerianNorthern EuropeanNorwegianOkinawanOsageOttawaPaiutePakistaniPalestinianPanamanianParaguayanPennsylvania GermanPeruvianPimaPolishPortuguesePotawatomiPuebloPuerto RicanPuget Sound SalishRomanianRussianSalvadoranSamoanScandinavianScotch-IrishScottishSeminoleSenegaleseSerbianShoshoneSierra LeoneanSiouxSlavicSlovakSloveneSomaliSouth AfricanSouth AmericanSouth American IndianSoviet UnionSpaniardSpanishSpanish AmericanSpanish American IndianSri LankanSubsaharan AfricanSudaneseSwedishSwissSyrianTaiwaneseThaiTlingit-HaidaTohono O'OdhamTonganTrinidadian and TobagonianTsimshianTurkishU.S. Virgin IslanderUgandanUkrainianUruguayanUteVenezuelanVietnameseWelshWest IndianYakamaYaquiYugoslavianYumanYup'ikZimbabwean
Immigration
NonimmigrantsImmigrantsAfghanistanAfricaAlbaniaArgentinaArmeniaAsiaAustraliaAustriaBahamasBangladeshBarbadosBelarusBelgiumBelizeBoliviaBosnia and HerzegovinaBrazilBulgariaBurma/MyanmarCabo VerdeCambodiaCameroonCanadaCaribbeanCentral AmericaChileChinaColombiaCongoCosta RicaCroatiaCubaCzechoslovakiaDenmarkDominicaDominican RepublicEastern AfricaEastern AsiaEastern EuropeEcuadorEgyptEnglandEritreaEthiopiaEuropeFijiFranceGermanyGhanaGreeceGrenadaGuatemalaGuyanaHaitiHondurasHong KongHungaryIndiaIndonesiaIranIraqIrelandIsraelItalyJamaicaJapanJordanKazakhstanKenyaKoreaKuwaitLaosLatin AmericaLatviaLebanonLiberiaLithuaniaMalaysiaMexicoMicronesiaMiddle AfricaMoldovaMoroccoNepalNetherlandsNicaraguaNigeriaNorth AmericaNorth MacedoniaNorthern AfricaNorthern EuropeNorwayOceaniaPakistanPanamaPeruPhilippinesPolandPortugalRomaniaRussiaSaudi ArabiaScotlandSenegalSerbiaSierra LeoneSingaporeSomaliaSouth AfricaSouth AmericaSouth Central AsiaSouth Eastern AsiaSouthern EuropeSpainSri LankaSt. Vincent and the GrenadinesSudanSwedenSwitzerlandSyriaTaiwanThailandTrinidad and TobagoTurkeyUgandaUkraineUruguayUzbekistanVenezuelaVietnamWest IndiesWestern AfricaWestern AsiaWestern EuropeYemenZaireZimbabweAzores
Immigrants from El Salvador
Race
Ancestry
AfghanAfricanAlaska NativeAlaskan AthabascanAlbanianAleutAlsatianAmericanApacheArabArapahoArgentineanArmenianAssyrian/Chaldean/SyriacAustralianAustrianBahamianBangladeshiBarbadianBasqueBelgianBelizeanBermudanBhutaneseBlackfeetBolivianBrazilianBritishBritish West IndianBulgarianBurmeseCajunCambodianCanadianCape VerdeanCarpatho RusynCelticCentral AmericanCentral American IndianCherokeeCheyenneChickasawChileanChineseChippewaChoctawColombianColvilleComancheCosta RicanCreeCreekCroatianCrowCubanCypriotCzechCzechoslovakianDanishDelawareDominicanDutchDutch West IndianEastern EuropeanEcuadorianEgyptianEnglishEstonianEthiopianEuropeanFijianFilipinoFinnishFrenchFrench American IndianFrench CanadianGermanGerman RussianGhanaianGreekGuamanian/ChamorroGuatemalanGuyaneseHaitianHmongHonduranHopiHoumaHungarianIcelanderIndian (Asian)IndonesianInupiatIranianIraqiIrishIroquoisIsraeliItalianJamaicanJapaneseJordanianKenyanKiowaKoreanLaotianLatvianLebaneseLithuanianLumbeeLuxembourgerMacedonianMalaysianMalteseMarshalleseMenomineeMexicanMexican American IndianMongolianMoroccanNative HawaiianNavajoNepaleseNew ZealanderNicaraguanNigerianNorthern EuropeanNorwegianOkinawanOsageOttawaPaiutePakistaniPalestinianPanamanianParaguayanPennsylvania GermanPeruvianPimaPolishPortuguesePotawatomiPuebloPuerto RicanPuget Sound SalishRomanianRussianSalvadoranSamoanScandinavianScotch-IrishScottishSeminoleSenegaleseSerbianShoshoneSierra LeoneanSiouxSlavicSlovakSloveneSomaliSouth AfricanSouth AmericanSouth American IndianSoviet UnionSpaniardSpanishSpanish AmericanSpanish American IndianSri LankanSubsaharan AfricanSudaneseSwedishSwissSyrianTaiwaneseThaiTlingit-HaidaTohono O'OdhamTonganTrinidadian and TobagonianTsimshianTurkishU.S. Virgin IslanderUgandanUkrainianUruguayanUteVenezuelanVietnameseWelshWest IndianYakamaYaquiYugoslavianYumanYup'ikZimbabwean
Immigration
NonimmigrantsImmigrantsAfghanistanAfricaAlbaniaArgentinaArmeniaAsiaAustraliaAustriaBahamasBangladeshBarbadosBelarusBelgiumBelizeBoliviaBosnia and HerzegovinaBrazilBulgariaBurma/MyanmarCabo VerdeCambodiaCameroonCanadaCaribbeanCentral AmericaChileChinaColombiaCongoCosta RicaCroatiaCubaCzechoslovakiaDenmarkDominicaDominican RepublicEastern AfricaEastern AsiaEastern EuropeEcuadorEgyptEl SalvadorEnglandEritreaEthiopiaEuropeFijiFranceGermanyGhanaGreeceGrenadaGuatemalaGuyanaHaitiHondurasHong KongHungaryIndiaIndonesiaIranIraqIrelandIsraelItalyJamaicaJapanJordanKazakhstanKenyaKoreaKuwaitLaosLatin AmericaLatviaLebanonLiberiaLithuaniaMalaysiaMexicoMicronesiaMiddle AfricaMoldovaMoroccoNepalNetherlandsNicaraguaNigeriaNorth AmericaNorth MacedoniaNorthern AfricaNorthern EuropeNorwayOceaniaPakistanPanamaPeruPhilippinesPolandPortugalRomaniaRussiaSaudi ArabiaScotlandSenegalSerbiaSierra LeoneSingaporeSomaliaSouth AfricaSouth AmericaSouth Central AsiaSouth Eastern AsiaSouthern EuropeSpainSri LankaSt. Vincent and the GrenadinesSudanSwedenSwitzerlandSyriaTaiwanThailandTrinidad and TobagoTurkeyUgandaUkraineUruguayUzbekistanVenezuelaVietnamWest IndiesWestern AfricaWestern AsiaWestern EuropeYemenZaireZimbabweAzores
Family Households
Income
Poverty
Unemployment
Labor Participation
Family Structure
Vehicle Availability
Education Level
Disability

Family Households Comparison

Liberians

Immigrants from El Salvador

Tragic
Exceptional
62.0%
FAMILY HOUSEHOLDS
0.0/ 100
METRIC RATING
313th/ 347
METRIC RANK
67.0%
FAMILY HOUSEHOLDS
100.0/ 100
METRIC RATING
39th/ 347
METRIC RANK

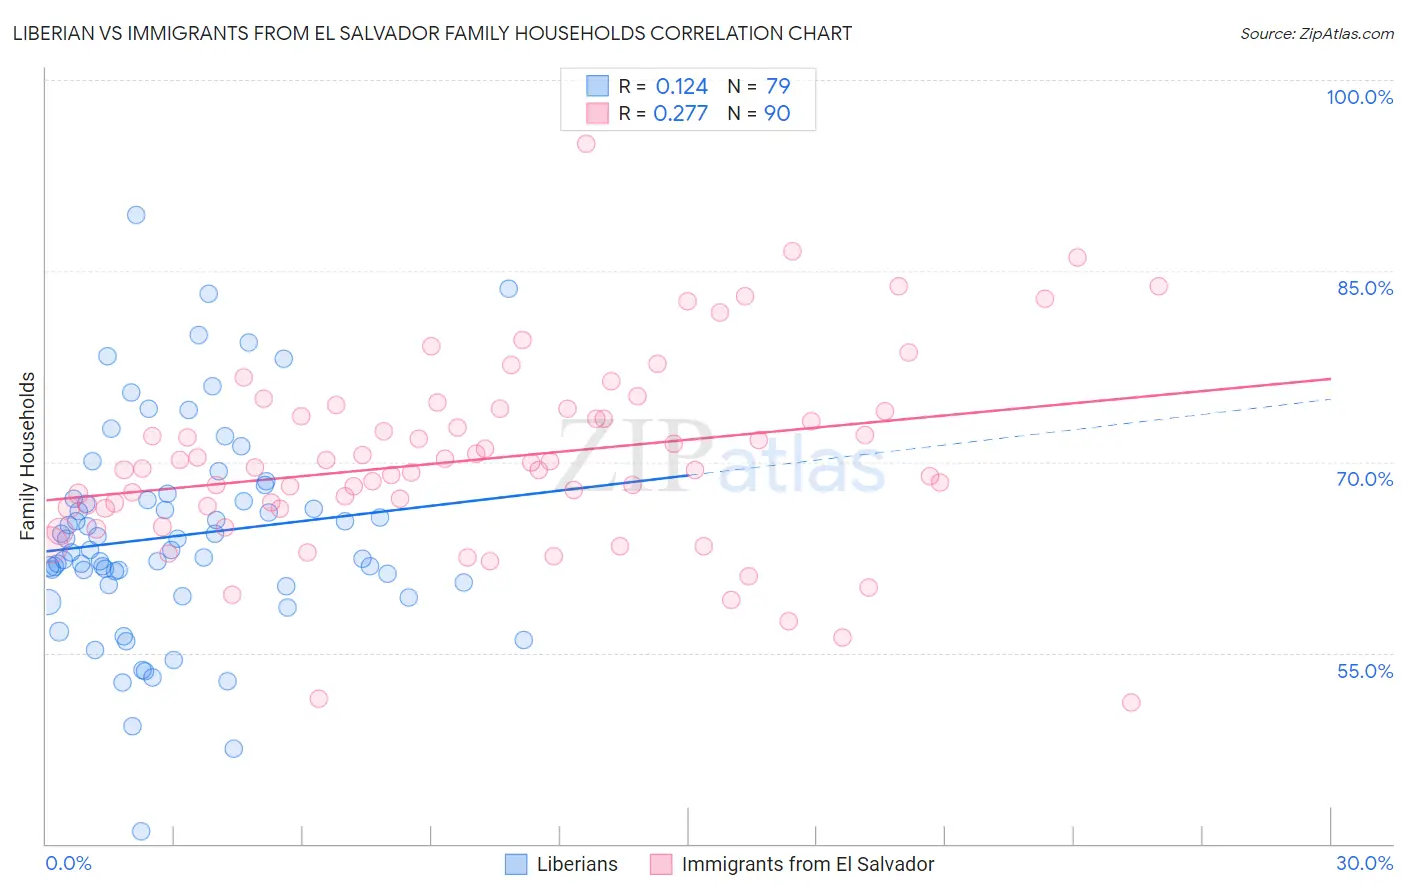
Liberian vs Immigrants from El Salvador Family Households Correlation Chart

The statistical analysis conducted on geographies consisting of 118,040,608 people shows a poor positive correlation between the proportion of Liberians and percentage of family households in the United States with a correlation coefficient (R) of 0.124 and weighted average of 62.0%. Similarly, the statistical analysis conducted on geographies consisting of 357,711,776 people shows a weak positive correlation between the proportion of Immigrants from El Salvador and percentage of family households in the United States with a correlation coefficient (R) of 0.277 and weighted average of 67.0%, a difference of 8.1%.
Liberian vs Immigrants from El Salvador Family Households

Family Households Correlation Summary

MeasurementLiberianImmigrants from El Salvador
Minimum40.9%51.1%
Maximum89.4%95.0%
Range48.5%43.8%
Mean64.2%70.2%
Median63.0%69.5%
Interquartile 25% (IQ1)60.3%66.4%
Interquartile 75% (IQ3)67.1%73.9%
Interquartile Range (IQR)6.8%7.5%
Standard Deviation (Sample)8.3%7.5%
Standard Deviation (Population)8.3%7.4%

Similar Demographics by Family Households

Demographics Similar to Liberians by Family Households

In terms of family households, the demographic groups most similar to Liberians are Immigrants from Latvia (62.0%, a difference of 0.010%), Immigrants from Morocco (62.0%, a difference of 0.050%), Immigrants from Cabo Verde (61.9%, a difference of 0.050%), Immigrants from Liberia (62.0%, a difference of 0.080%), and Moroccan (61.9%, a difference of 0.090%).
DemographicsRating | RankFamily Households
Africans
0.0
/100
|
#306
Tragic
62.1%
Immigrants | Norway
0.0
/100
|
#307
Tragic
62.1%
Chippewa
0.0
/100
|
#308
Tragic
62.1%
Sub-Saharan Africans
0.0
/100
|
#309
Tragic
62.1%
Immigrants | Liberia
0.0
/100
|
#310
Tragic
62.0%
Immigrants | Morocco
0.0
/100
|
#311
Tragic
62.0%
Immigrants | Latvia
0.0
/100
|
#312
Tragic
62.0%
Liberians
0.0
/100
|
#313
Tragic
62.0%
Immigrants | Cabo Verde
0.0
/100
|
#314
Tragic
61.9%
Moroccans
0.0
/100
|
#315
Tragic
61.9%
Immigrants | Middle Africa
0.0
/100
|
#316
Tragic
61.9%
Immigrants | Bosnia and Herzegovina
0.0
/100
|
#317
Tragic
61.9%
Alaskan Athabascans
0.0
/100
|
#318
Tragic
61.8%
Cape Verdeans
0.0
/100
|
#319
Tragic
61.8%
Ugandans
0.0
/100
|
#320
Tragic
61.7%

Demographics Similar to Immigrants from El Salvador by Family Households

In terms of family households, the demographic groups most similar to Immigrants from El Salvador are Mexican American Indian (67.0%, a difference of 0.020%), Tsimshian (67.1%, a difference of 0.12%), Peruvian (67.1%, a difference of 0.19%), Tohono O'odham (67.1%, a difference of 0.20%), and Salvadoran (67.2%, a difference of 0.25%).
DemographicsRating | RankFamily Households
Nepalese
100.0
/100
|
#32
Exceptional
67.2%
Salvadorans
100.0
/100
|
#33
Exceptional
67.2%
Thais
100.0
/100
|
#34
Exceptional
67.2%
Tohono O'odham
100.0
/100
|
#35
Exceptional
67.1%
Peruvians
100.0
/100
|
#36
Exceptional
67.1%
Tsimshian
100.0
/100
|
#37
Exceptional
67.1%
Mexican American Indians
100.0
/100
|
#38
Exceptional
67.0%
Immigrants | El Salvador
100.0
/100
|
#39
Exceptional
67.0%
Guamanians/Chamorros
100.0
/100
|
#40
Exceptional
66.6%
Immigrants | Bolivia
100.0
/100
|
#41
Exceptional
66.6%
Menominee
100.0
/100
|
#42
Exceptional
66.5%
Apache
100.0
/100
|
#43
Exceptional
66.5%
Asians
100.0
/100
|
#44
Exceptional
66.5%
Venezuelans
100.0
/100
|
#45
Exceptional
66.5%
Arapaho
100.0
/100
|
#46
Exceptional
66.5%