Liberian vs Immigrants from Poland Family Households
COMPARE
Liberian
Immigrants from Poland
Family Households
Family Households Comparison
Liberians
Immigrants from Poland
62.0%
FAMILY HOUSEHOLDS
0.0/ 100
METRIC RATING
313th/ 347
METRIC RANK
65.2%
FAMILY HOUSEHOLDS
98.7/ 100
METRIC RATING
94th/ 347
METRIC RANK
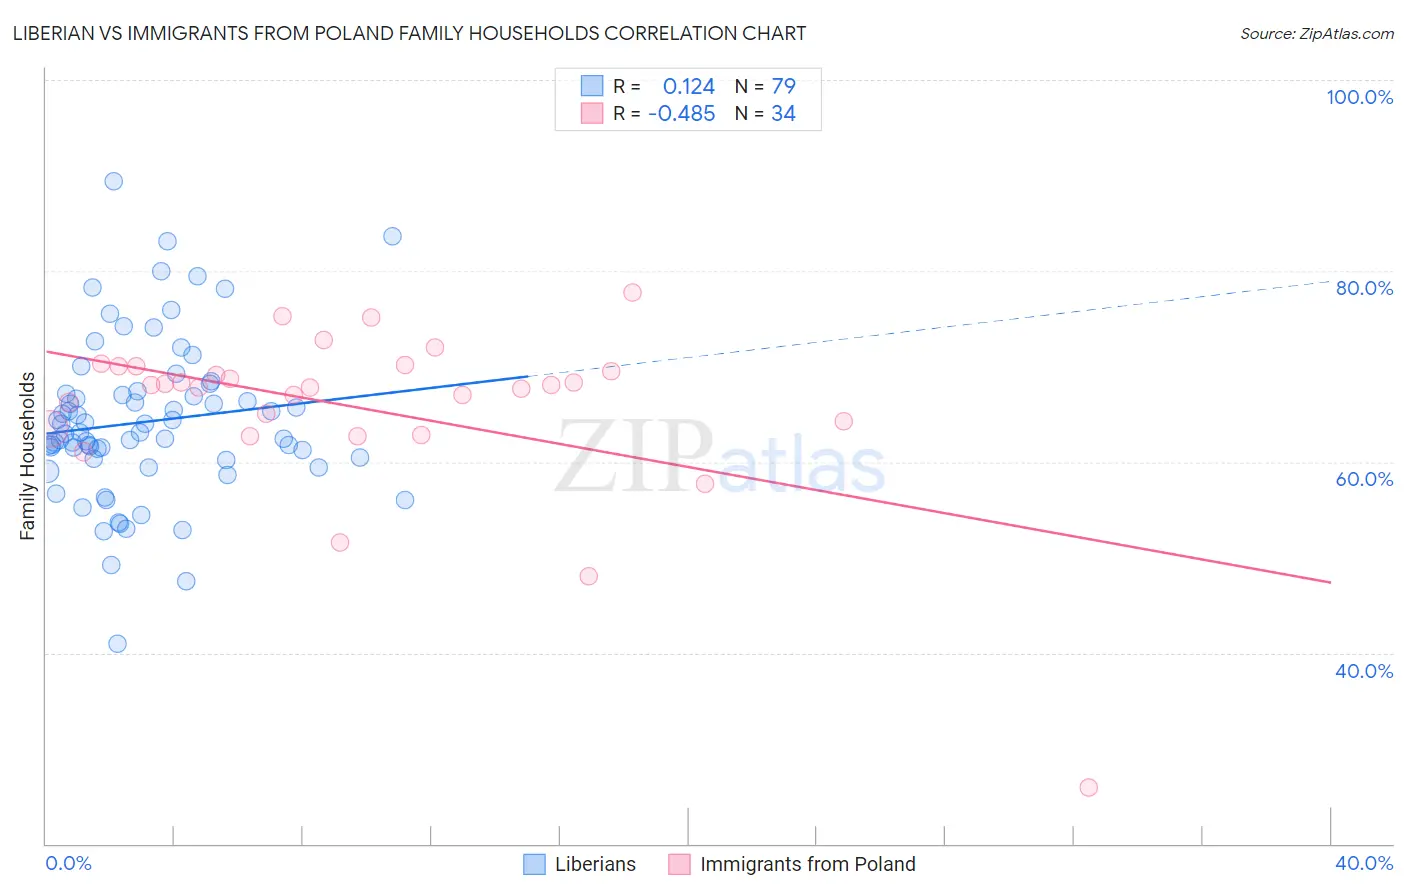
Liberian vs Immigrants from Poland Family Households Correlation Chart
The statistical analysis conducted on geographies consisting of 118,040,608 people shows a poor positive correlation between the proportion of Liberians and percentage of family households in the United States with a correlation coefficient (R) of 0.124 and weighted average of 62.0%. Similarly, the statistical analysis conducted on geographies consisting of 304,786,496 people shows a moderate negative correlation between the proportion of Immigrants from Poland and percentage of family households in the United States with a correlation coefficient (R) of -0.485 and weighted average of 65.2%, a difference of 5.3%.
Family Households Correlation Summary
| Measurement | Liberian | Immigrants from Poland |
| Minimum | 40.9% | 25.9% |
| Maximum | 89.4% | 77.7% |
| Range | 48.5% | 51.8% |
| Mean | 64.2% | 65.6% |
| Median | 63.0% | 67.9% |
| Interquartile 25% (IQ1) | 60.3% | 63.4% |
| Interquartile 75% (IQ3) | 67.1% | 70.0% |
| Interquartile Range (IQR) | 6.8% | 6.6% |
| Standard Deviation (Sample) | 8.3% | 9.2% |
| Standard Deviation (Population) | 8.3% | 9.0% |
Similar Demographics by Family Households
Demographics Similar to Liberians by Family Households
In terms of family households, the demographic groups most similar to Liberians are Immigrants from Latvia (62.0%, a difference of 0.010%), Immigrants from Morocco (62.0%, a difference of 0.050%), Immigrants from Cabo Verde (61.9%, a difference of 0.050%), Immigrants from Liberia (62.0%, a difference of 0.080%), and Moroccan (61.9%, a difference of 0.090%).
| Demographics | Rating | Rank | Family Households |
| Africans | 0.0 /100 | #306 | Tragic 62.1% |
| Immigrants | Norway | 0.0 /100 | #307 | Tragic 62.1% |
| Chippewa | 0.0 /100 | #308 | Tragic 62.1% |
| Sub-Saharan Africans | 0.0 /100 | #309 | Tragic 62.1% |
| Immigrants | Liberia | 0.0 /100 | #310 | Tragic 62.0% |
| Immigrants | Morocco | 0.0 /100 | #311 | Tragic 62.0% |
| Immigrants | Latvia | 0.0 /100 | #312 | Tragic 62.0% |
| Liberians | 0.0 /100 | #313 | Tragic 62.0% |
| Immigrants | Cabo Verde | 0.0 /100 | #314 | Tragic 61.9% |
| Moroccans | 0.0 /100 | #315 | Tragic 61.9% |
| Immigrants | Middle Africa | 0.0 /100 | #316 | Tragic 61.9% |
| Immigrants | Bosnia and Herzegovina | 0.0 /100 | #317 | Tragic 61.9% |
| Alaskan Athabascans | 0.0 /100 | #318 | Tragic 61.8% |
| Cape Verdeans | 0.0 /100 | #319 | Tragic 61.8% |
| Ugandans | 0.0 /100 | #320 | Tragic 61.7% |
Demographics Similar to Immigrants from Poland by Family Households
In terms of family households, the demographic groups most similar to Immigrants from Poland are Hopi (65.3%, a difference of 0.020%), Guyanese (65.3%, a difference of 0.020%), Immigrants from Portugal (65.2%, a difference of 0.030%), Swiss (65.2%, a difference of 0.030%), and Guatemalan (65.2%, a difference of 0.030%).
| Demographics | Rating | Rank | Family Households |
| Immigrants | Egypt | 99.2 /100 | #87 | Exceptional 65.3% |
| Immigrants | Haiti | 99.1 /100 | #88 | Exceptional 65.3% |
| Immigrants | Caribbean | 99.1 /100 | #89 | Exceptional 65.3% |
| Immigrants | Laos | 99.1 /100 | #90 | Exceptional 65.3% |
| Crow | 98.9 /100 | #91 | Exceptional 65.3% |
| Hopi | 98.8 /100 | #92 | Exceptional 65.3% |
| Guyanese | 98.8 /100 | #93 | Exceptional 65.3% |
| Immigrants | Poland | 98.7 /100 | #94 | Exceptional 65.2% |
| Immigrants | Portugal | 98.6 /100 | #95 | Exceptional 65.2% |
| Swiss | 98.6 /100 | #96 | Exceptional 65.2% |
| Guatemalans | 98.6 /100 | #97 | Exceptional 65.2% |
| Immigrants | Syria | 98.4 /100 | #98 | Exceptional 65.2% |
| Central American Indians | 98.3 /100 | #99 | Exceptional 65.2% |
| Haitians | 98.1 /100 | #100 | Exceptional 65.2% |
| Chileans | 98.1 /100 | #101 | Exceptional 65.2% |