Taiwanese vs Immigrants from El Salvador Family Households
COMPARE
Taiwanese
Immigrants from El Salvador
Family Households
Family Households Comparison
Taiwanese
Immigrants from El Salvador
63.3%
FAMILY HOUSEHOLDS
1.2/ 100
METRIC RATING
251st/ 347
METRIC RANK
67.0%
FAMILY HOUSEHOLDS
100.0/ 100
METRIC RATING
39th/ 347
METRIC RANK
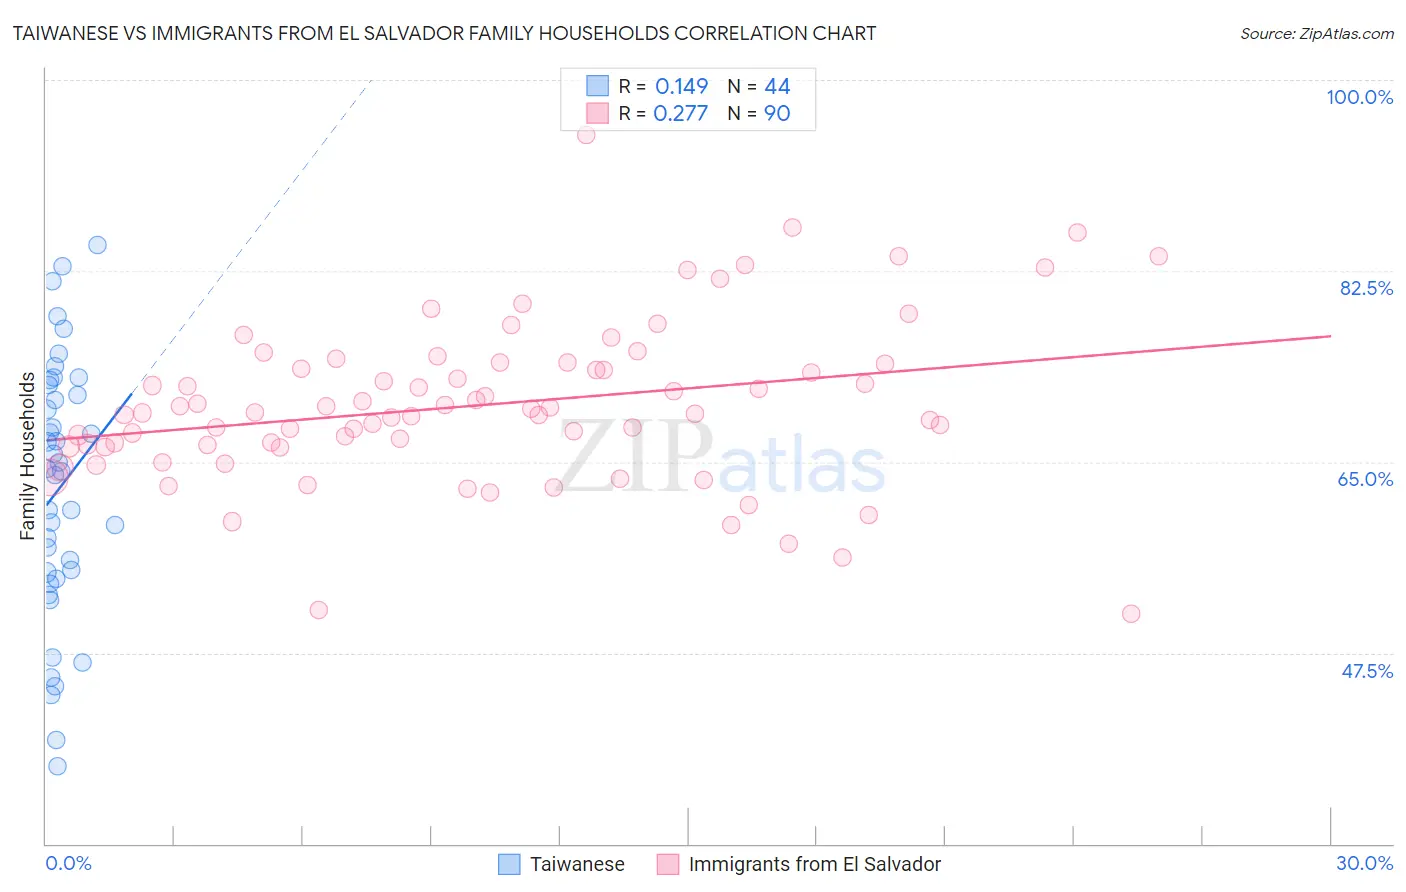
Taiwanese vs Immigrants from El Salvador Family Households Correlation Chart
The statistical analysis conducted on geographies consisting of 31,715,954 people shows a poor positive correlation between the proportion of Taiwanese and percentage of family households in the United States with a correlation coefficient (R) of 0.149 and weighted average of 63.3%. Similarly, the statistical analysis conducted on geographies consisting of 357,711,776 people shows a weak positive correlation between the proportion of Immigrants from El Salvador and percentage of family households in the United States with a correlation coefficient (R) of 0.277 and weighted average of 67.0%, a difference of 5.8%.
Family Households Correlation Summary
| Measurement | Taiwanese | Immigrants from El Salvador |
| Minimum | 37.1% | 51.1% |
| Maximum | 84.9% | 95.0% |
| Range | 47.7% | 43.8% |
| Mean | 62.6% | 70.2% |
| Median | 64.3% | 69.5% |
| Interquartile 25% (IQ1) | 54.6% | 66.4% |
| Interquartile 75% (IQ3) | 71.6% | 73.9% |
| Interquartile Range (IQR) | 17.0% | 7.5% |
| Standard Deviation (Sample) | 11.8% | 7.5% |
| Standard Deviation (Population) | 11.7% | 7.4% |
Similar Demographics by Family Households
Demographics Similar to Taiwanese by Family Households
In terms of family households, the demographic groups most similar to Taiwanese are Bahamian (63.3%, a difference of 0.010%), Immigrants from Dominican Republic (63.3%, a difference of 0.040%), Slovak (63.3%, a difference of 0.040%), Immigrants from Japan (63.4%, a difference of 0.050%), and Russian (63.4%, a difference of 0.070%).
| Demographics | Rating | Rank | Family Households |
| Eastern Europeans | 1.6 /100 | #244 | Tragic 63.4% |
| Immigrants | Dominica | 1.6 /100 | #245 | Tragic 63.4% |
| Immigrants | Ghana | 1.6 /100 | #246 | Tragic 63.4% |
| Immigrants | Uzbekistan | 1.5 /100 | #247 | Tragic 63.4% |
| Dominicans | 1.5 /100 | #248 | Tragic 63.4% |
| Russians | 1.4 /100 | #249 | Tragic 63.4% |
| Immigrants | Japan | 1.4 /100 | #250 | Tragic 63.4% |
| Taiwanese | 1.2 /100 | #251 | Tragic 63.3% |
| Bahamians | 1.1 /100 | #252 | Tragic 63.3% |
| Immigrants | Dominican Republic | 1.0 /100 | #253 | Tragic 63.3% |
| Slovaks | 1.0 /100 | #254 | Tragic 63.3% |
| Potawatomi | 1.0 /100 | #255 | Tragic 63.3% |
| Luxembourgers | 0.9 /100 | #256 | Tragic 63.3% |
| Icelanders | 0.8 /100 | #257 | Tragic 63.3% |
| Immigrants | Barbados | 0.7 /100 | #258 | Tragic 63.2% |
Demographics Similar to Immigrants from El Salvador by Family Households
In terms of family households, the demographic groups most similar to Immigrants from El Salvador are Mexican American Indian (67.0%, a difference of 0.020%), Tsimshian (67.1%, a difference of 0.12%), Peruvian (67.1%, a difference of 0.19%), Tohono O'odham (67.1%, a difference of 0.20%), and Salvadoran (67.2%, a difference of 0.25%).
| Demographics | Rating | Rank | Family Households |
| Nepalese | 100.0 /100 | #32 | Exceptional 67.2% |
| Salvadorans | 100.0 /100 | #33 | Exceptional 67.2% |
| Thais | 100.0 /100 | #34 | Exceptional 67.2% |
| Tohono O'odham | 100.0 /100 | #35 | Exceptional 67.1% |
| Peruvians | 100.0 /100 | #36 | Exceptional 67.1% |
| Tsimshian | 100.0 /100 | #37 | Exceptional 67.1% |
| Mexican American Indians | 100.0 /100 | #38 | Exceptional 67.0% |
| Immigrants | El Salvador | 100.0 /100 | #39 | Exceptional 67.0% |
| Guamanians/Chamorros | 100.0 /100 | #40 | Exceptional 66.6% |
| Immigrants | Bolivia | 100.0 /100 | #41 | Exceptional 66.6% |
| Menominee | 100.0 /100 | #42 | Exceptional 66.5% |
| Apache | 100.0 /100 | #43 | Exceptional 66.5% |
| Asians | 100.0 /100 | #44 | Exceptional 66.5% |
| Venezuelans | 100.0 /100 | #45 | Exceptional 66.5% |
| Arapaho | 100.0 /100 | #46 | Exceptional 66.5% |