Syrian vs Cree Births to Unmarried Women
COMPARE
Syrian
Cree
Births to Unmarried Women
Births to Unmarried Women Comparison
Syrians
Cree
30.2%
BIRTHS TO UNMARRIED WOMEN
88.2/ 100
METRIC RATING
123rd/ 347
METRIC RANK
37.0%
BIRTHS TO UNMARRIED WOMEN
0.1/ 100
METRIC RATING
274th/ 347
METRIC RANK
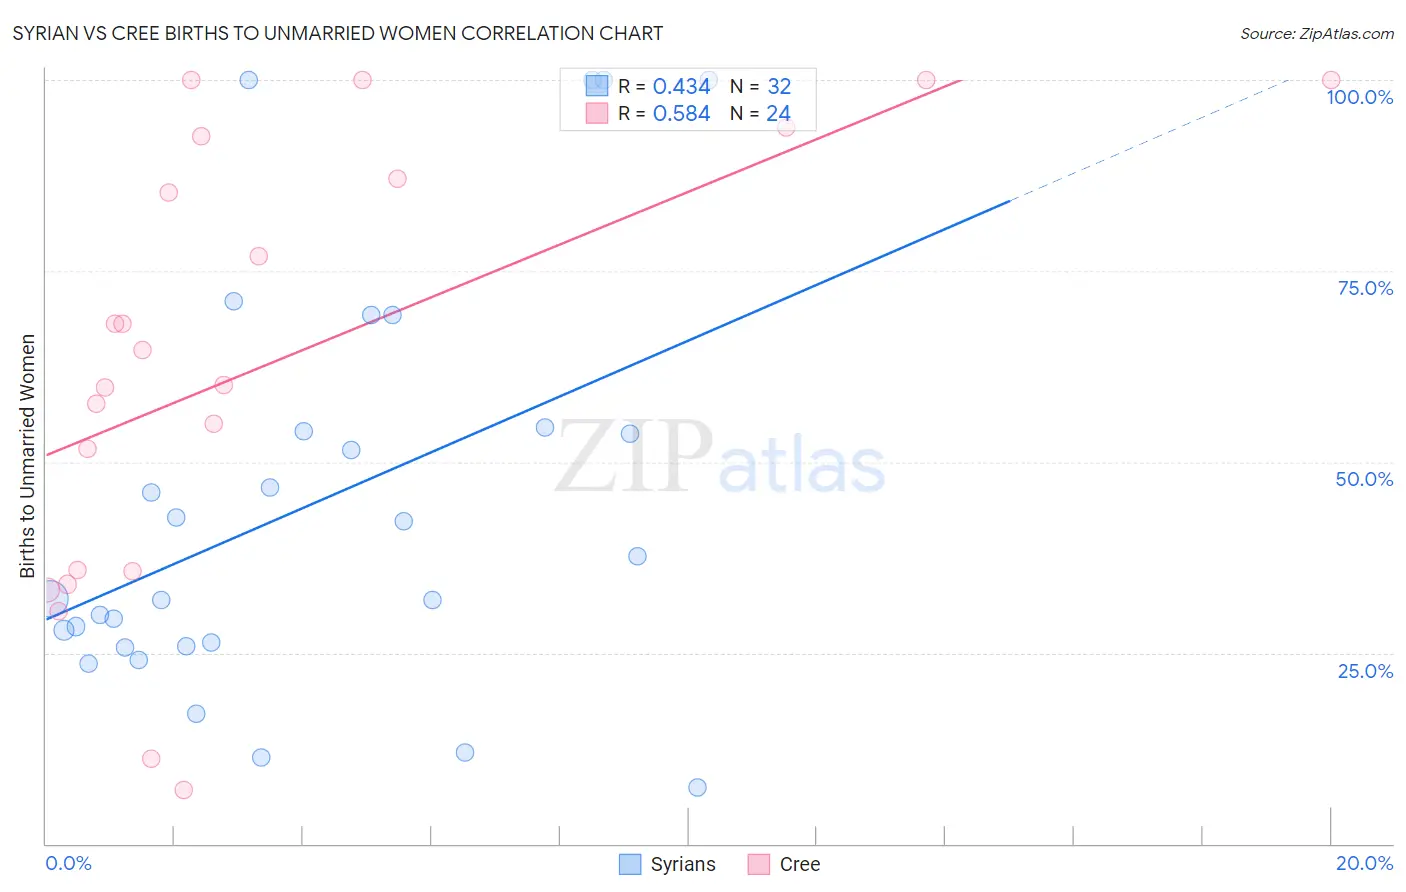
Syrian vs Cree Births to Unmarried Women Correlation Chart
The statistical analysis conducted on geographies consisting of 250,644,243 people shows a moderate positive correlation between the proportion of Syrians and percentage of births to unmarried women in the United States with a correlation coefficient (R) of 0.434 and weighted average of 30.2%. Similarly, the statistical analysis conducted on geographies consisting of 74,807,025 people shows a substantial positive correlation between the proportion of Cree and percentage of births to unmarried women in the United States with a correlation coefficient (R) of 0.584 and weighted average of 37.0%, a difference of 22.5%.
Births to Unmarried Women Correlation Summary
| Measurement | Syrian | Cree |
| Minimum | 7.3% | 7.1% |
| Maximum | 100.0% | 100.0% |
| Range | 92.7% | 92.9% |
| Mean | 44.5% | 62.8% |
| Median | 34.9% | 62.3% |
| Interquartile 25% (IQ1) | 26.1% | 35.7% |
| Interquartile 75% (IQ3) | 54.3% | 89.8% |
| Interquartile Range (IQR) | 28.2% | 54.1% |
| Standard Deviation (Sample) | 26.8% | 28.7% |
| Standard Deviation (Population) | 26.4% | 28.1% |
Similar Demographics by Births to Unmarried Women
Demographics Similar to Syrians by Births to Unmarried Women
In terms of births to unmarried women, the demographic groups most similar to Syrians are Croatian (30.2%, a difference of 0.040%), Vietnamese (30.2%, a difference of 0.11%), Immigrants from Argentina (30.1%, a difference of 0.13%), Korean (30.1%, a difference of 0.18%), and European (30.2%, a difference of 0.23%).
| Demographics | Rating | Rank | Births to Unmarried Women |
| Immigrants | Italy | 91.7 /100 | #116 | Exceptional 29.9% |
| Immigrants | Netherlands | 91.1 /100 | #117 | Exceptional 29.9% |
| Immigrants | Norway | 91.0 /100 | #118 | Exceptional 29.9% |
| Argentineans | 90.5 /100 | #119 | Exceptional 30.0% |
| Ugandans | 89.2 /100 | #120 | Excellent 30.1% |
| Koreans | 88.9 /100 | #121 | Excellent 30.1% |
| Immigrants | Argentina | 88.7 /100 | #122 | Excellent 30.1% |
| Syrians | 88.2 /100 | #123 | Excellent 30.2% |
| Croatians | 88.0 /100 | #124 | Excellent 30.2% |
| Vietnamese | 87.7 /100 | #125 | Excellent 30.2% |
| Europeans | 87.2 /100 | #126 | Excellent 30.2% |
| Chinese | 87.1 /100 | #127 | Excellent 30.2% |
| Icelanders | 86.0 /100 | #128 | Excellent 30.3% |
| Immigrants | Spain | 85.8 /100 | #129 | Excellent 30.3% |
| Immigrants | Bosnia and Herzegovina | 85.7 /100 | #130 | Excellent 30.3% |
Demographics Similar to Cree by Births to Unmarried Women
In terms of births to unmarried women, the demographic groups most similar to Cree are Barbadian (37.0%, a difference of 0.030%), Mexican (36.9%, a difference of 0.090%), Choctaw (36.9%, a difference of 0.21%), Belizean (37.0%, a difference of 0.22%), and Immigrants from Barbados (36.8%, a difference of 0.43%).
| Demographics | Rating | Rank | Births to Unmarried Women |
| Central Americans | 0.1 /100 | #267 | Tragic 36.7% |
| Comanche | 0.1 /100 | #268 | Tragic 36.7% |
| Senegalese | 0.1 /100 | #269 | Tragic 36.8% |
| Immigrants | Congo | 0.1 /100 | #270 | Tragic 36.8% |
| Immigrants | Barbados | 0.1 /100 | #271 | Tragic 36.8% |
| Choctaw | 0.1 /100 | #272 | Tragic 36.9% |
| Mexicans | 0.1 /100 | #273 | Tragic 36.9% |
| Cree | 0.1 /100 | #274 | Tragic 37.0% |
| Barbadians | 0.1 /100 | #275 | Tragic 37.0% |
| Belizeans | 0.1 /100 | #276 | Tragic 37.0% |
| Guatemalans | 0.1 /100 | #277 | Tragic 37.1% |
| Immigrants | Latin America | 0.1 /100 | #278 | Tragic 37.1% |
| West Indians | 0.1 /100 | #279 | Tragic 37.3% |
| Immigrants | St. Vincent and the Grenadines | 0.1 /100 | #280 | Tragic 37.3% |
| Immigrants | Belize | 0.1 /100 | #281 | Tragic 37.3% |