Lebanese vs Immigrants from Belgium Currently Married
COMPARE
Lebanese
Immigrants from Belgium
Currently Married
Currently Married Comparison
Lebanese
Immigrants from Belgium
47.9%
CURRENTLY MARRIED
95.1/ 100
METRIC RATING
93rd/ 347
METRIC RANK
48.1%
CURRENTLY MARRIED
97.1/ 100
METRIC RATING
78th/ 347
METRIC RANK
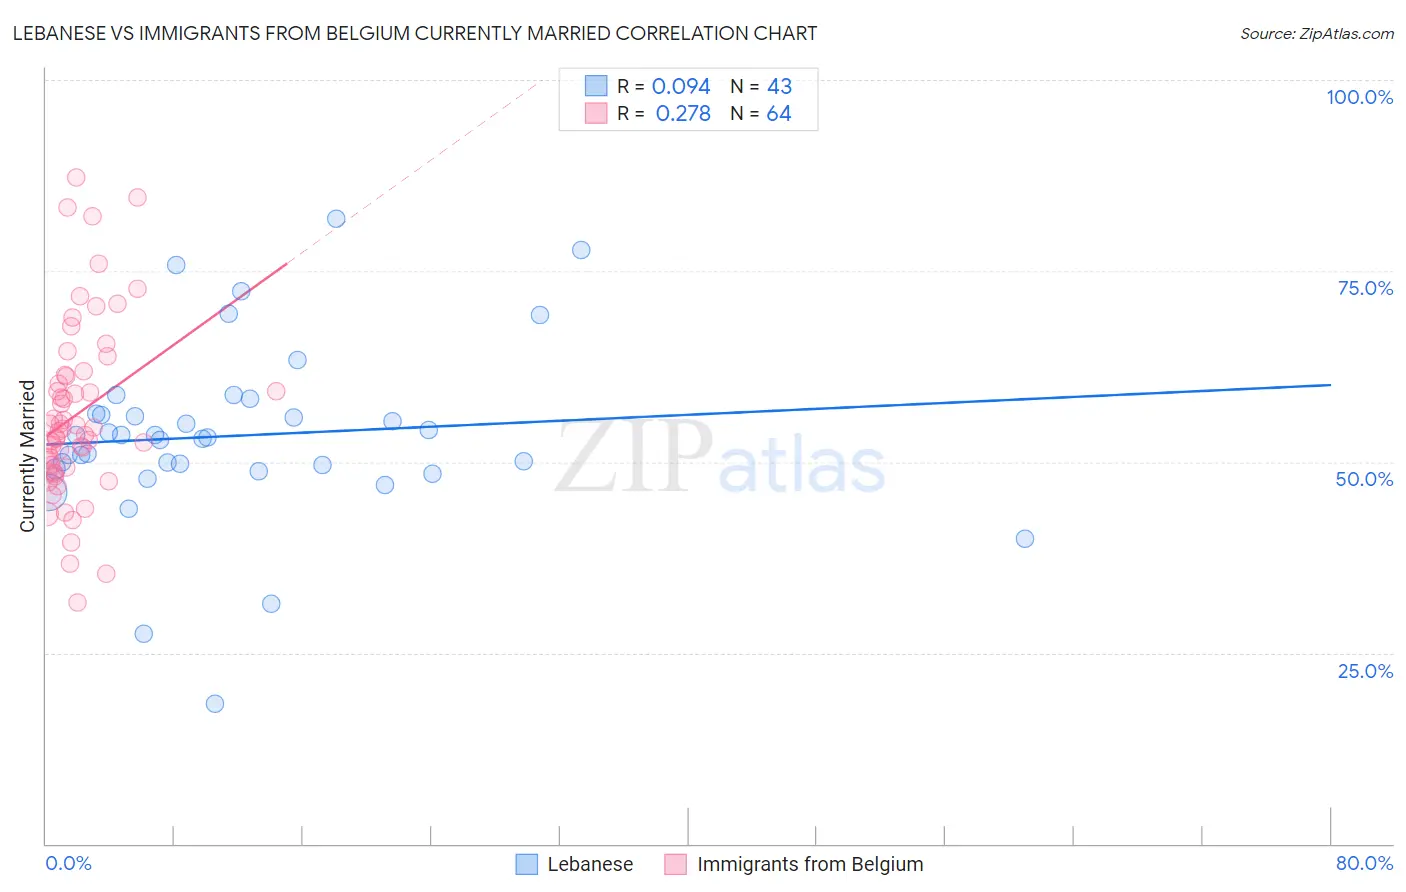
Lebanese vs Immigrants from Belgium Currently Married Correlation Chart
The statistical analysis conducted on geographies consisting of 401,555,158 people shows a slight positive correlation between the proportion of Lebanese and percentage of population currently married in the United States with a correlation coefficient (R) of 0.094 and weighted average of 47.9%. Similarly, the statistical analysis conducted on geographies consisting of 146,720,291 people shows a weak positive correlation between the proportion of Immigrants from Belgium and percentage of population currently married in the United States with a correlation coefficient (R) of 0.278 and weighted average of 48.1%, a difference of 0.47%.
Currently Married Correlation Summary
| Measurement | Lebanese | Immigrants from Belgium |
| Minimum | 18.3% | 31.6% |
| Maximum | 81.9% | 87.2% |
| Range | 63.6% | 55.6% |
| Mean | 53.4% | 56.2% |
| Median | 53.2% | 54.1% |
| Interquartile 25% (IQ1) | 49.1% | 49.0% |
| Interquartile 75% (IQ3) | 56.3% | 61.3% |
| Interquartile Range (IQR) | 7.3% | 12.4% |
| Standard Deviation (Sample) | 11.9% | 11.6% |
| Standard Deviation (Population) | 11.7% | 11.5% |
Demographics Similar to Lebanese and Immigrants from Belgium by Currently Married
In terms of currently married, the demographic groups most similar to Lebanese are Native Hawaiian (47.9%, a difference of 0.010%), Korean (47.9%, a difference of 0.050%), Immigrants from Bulgaria (47.9%, a difference of 0.050%), Immigrants from Bolivia (47.9%, a difference of 0.090%), and American (48.0%, a difference of 0.12%). Similarly, the demographic groups most similar to Immigrants from Belgium are Slovene (48.1%, a difference of 0.010%), Immigrants from South Africa (48.1%, a difference of 0.010%), Basque (48.1%, a difference of 0.030%), Immigrants from Poland (48.1%, a difference of 0.040%), and Immigrants from Belarus (48.1%, a difference of 0.050%).
| Demographics | Rating | Rank | Currently Married |
| Immigrants | Belarus | 97.2 /100 | #75 | Exceptional 48.1% |
| Basques | 97.2 /100 | #76 | Exceptional 48.1% |
| Slovenes | 97.1 /100 | #77 | Exceptional 48.1% |
| Immigrants | Belgium | 97.1 /100 | #78 | Exceptional 48.1% |
| Immigrants | South Africa | 97.0 /100 | #79 | Exceptional 48.1% |
| Immigrants | Poland | 96.9 /100 | #80 | Exceptional 48.1% |
| Immigrants | Sri Lanka | 96.9 /100 | #81 | Exceptional 48.1% |
| Immigrants | Europe | 96.9 /100 | #82 | Exceptional 48.1% |
| Bolivians | 96.9 /100 | #83 | Exceptional 48.1% |
| Immigrants | Israel | 96.9 /100 | #84 | Exceptional 48.1% |
| French Canadians | 96.3 /100 | #85 | Exceptional 48.0% |
| Immigrants | Japan | 96.2 /100 | #86 | Exceptional 48.0% |
| Jordanians | 96.2 /100 | #87 | Exceptional 48.0% |
| Immigrants | Eastern Europe | 96.1 /100 | #88 | Exceptional 48.0% |
| Indians (Asian) | 95.8 /100 | #89 | Exceptional 48.0% |
| Americans | 95.7 /100 | #90 | Exceptional 48.0% |
| Immigrants | Bolivia | 95.6 /100 | #91 | Exceptional 47.9% |
| Koreans | 95.4 /100 | #92 | Exceptional 47.9% |
| Lebanese | 95.1 /100 | #93 | Exceptional 47.9% |
| Native Hawaiians | 95.0 /100 | #94 | Exceptional 47.9% |
| Immigrants | Bulgaria | 94.8 /100 | #95 | Exceptional 47.9% |