Lebanese vs Immigrants from Guatemala Currently Married
COMPARE
Lebanese
Immigrants from Guatemala
Currently Married
Currently Married Comparison
Lebanese
Immigrants from Guatemala
47.9%
CURRENTLY MARRIED
95.1/ 100
METRIC RATING
93rd/ 347
METRIC RANK
42.6%
CURRENTLY MARRIED
0.0/ 100
METRIC RATING
291st/ 347
METRIC RANK
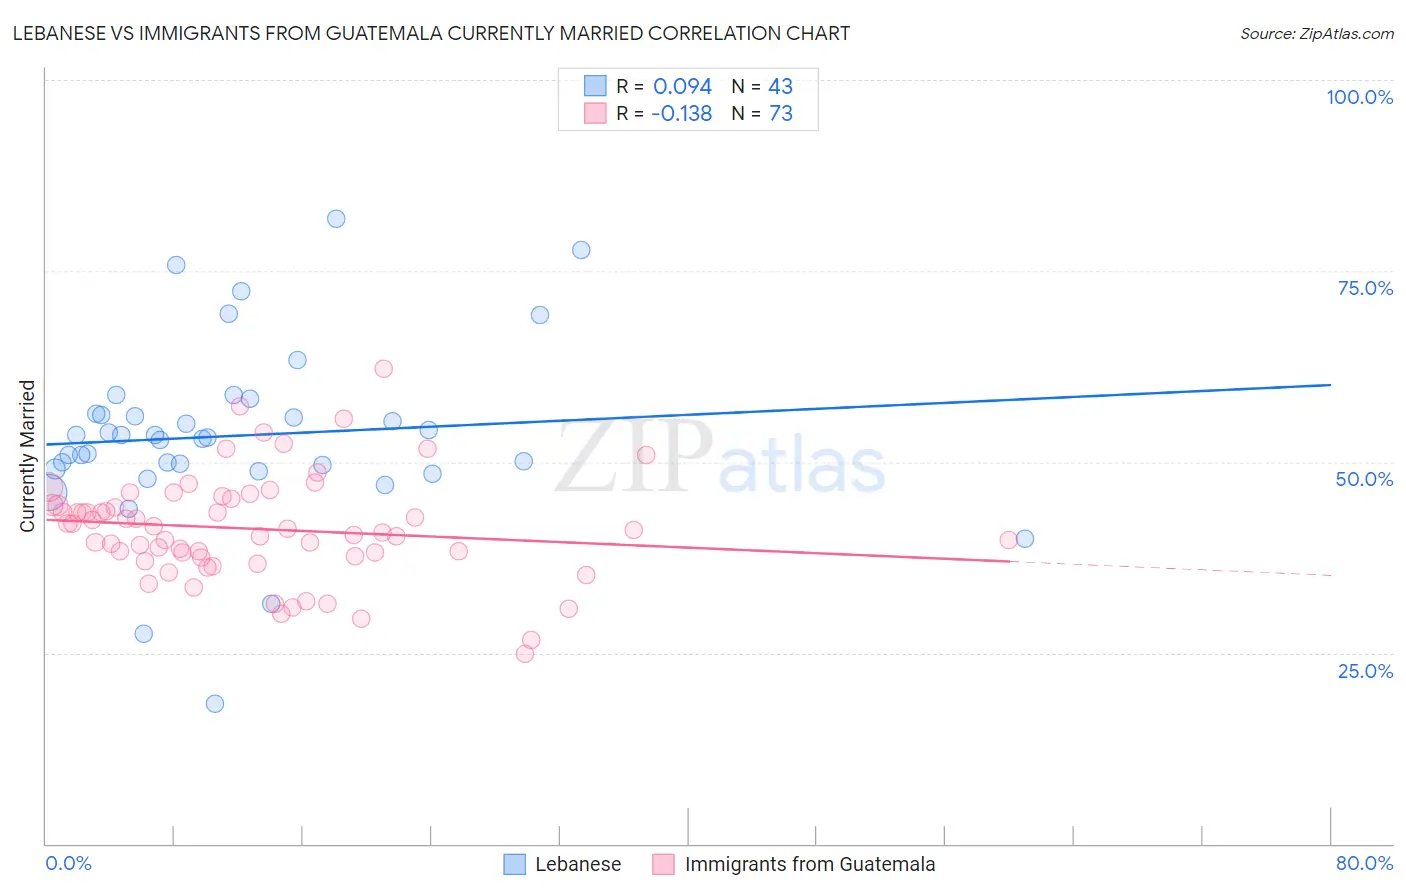
Lebanese vs Immigrants from Guatemala Currently Married Correlation Chart
The statistical analysis conducted on geographies consisting of 401,555,158 people shows a slight positive correlation between the proportion of Lebanese and percentage of population currently married in the United States with a correlation coefficient (R) of 0.094 and weighted average of 47.9%. Similarly, the statistical analysis conducted on geographies consisting of 377,254,434 people shows a poor negative correlation between the proportion of Immigrants from Guatemala and percentage of population currently married in the United States with a correlation coefficient (R) of -0.138 and weighted average of 42.6%, a difference of 12.3%.
Currently Married Correlation Summary
| Measurement | Lebanese | Immigrants from Guatemala |
| Minimum | 18.3% | 24.9% |
| Maximum | 81.9% | 62.2% |
| Range | 63.6% | 37.3% |
| Mean | 53.4% | 41.2% |
| Median | 53.2% | 41.0% |
| Interquartile 25% (IQ1) | 49.1% | 37.6% |
| Interquartile 75% (IQ3) | 56.3% | 44.7% |
| Interquartile Range (IQR) | 7.3% | 7.1% |
| Standard Deviation (Sample) | 11.9% | 6.9% |
| Standard Deviation (Population) | 11.7% | 6.9% |
Similar Demographics by Currently Married
Demographics Similar to Lebanese by Currently Married
In terms of currently married, the demographic groups most similar to Lebanese are Native Hawaiian (47.9%, a difference of 0.010%), Korean (47.9%, a difference of 0.050%), Immigrants from Bulgaria (47.9%, a difference of 0.050%), Egyptian (47.9%, a difference of 0.050%), and Immigrants from Ukraine (47.9%, a difference of 0.060%).
| Demographics | Rating | Rank | Currently Married |
| Immigrants | Japan | 96.2 /100 | #86 | Exceptional 48.0% |
| Jordanians | 96.2 /100 | #87 | Exceptional 48.0% |
| Immigrants | Eastern Europe | 96.1 /100 | #88 | Exceptional 48.0% |
| Indians (Asian) | 95.8 /100 | #89 | Exceptional 48.0% |
| Americans | 95.7 /100 | #90 | Exceptional 48.0% |
| Immigrants | Bolivia | 95.6 /100 | #91 | Exceptional 47.9% |
| Koreans | 95.4 /100 | #92 | Exceptional 47.9% |
| Lebanese | 95.1 /100 | #93 | Exceptional 47.9% |
| Native Hawaiians | 95.0 /100 | #94 | Exceptional 47.9% |
| Immigrants | Bulgaria | 94.8 /100 | #95 | Exceptional 47.9% |
| Egyptians | 94.8 /100 | #96 | Exceptional 47.9% |
| Immigrants | Ukraine | 94.8 /100 | #97 | Exceptional 47.9% |
| Immigrants | China | 94.7 /100 | #98 | Exceptional 47.9% |
| Immigrants | Sweden | 94.3 /100 | #99 | Exceptional 47.8% |
| Celtics | 94.2 /100 | #100 | Exceptional 47.8% |
Demographics Similar to Immigrants from Guatemala by Currently Married
In terms of currently married, the demographic groups most similar to Immigrants from Guatemala are Paiute (42.7%, a difference of 0.12%), Immigrants from Ghana (42.7%, a difference of 0.12%), Subsaharan African (42.6%, a difference of 0.16%), Yuman (42.6%, a difference of 0.18%), and Honduran (42.5%, a difference of 0.30%).
| Demographics | Rating | Rank | Currently Married |
| Immigrants | El Salvador | 0.0 /100 | #284 | Tragic 43.1% |
| Immigrants | Middle Africa | 0.0 /100 | #285 | Tragic 43.0% |
| Ghanaians | 0.0 /100 | #286 | Tragic 42.9% |
| Guatemalans | 0.0 /100 | #287 | Tragic 42.9% |
| Natives/Alaskans | 0.0 /100 | #288 | Tragic 42.8% |
| Paiute | 0.0 /100 | #289 | Tragic 42.7% |
| Immigrants | Ghana | 0.0 /100 | #290 | Tragic 42.7% |
| Immigrants | Guatemala | 0.0 /100 | #291 | Tragic 42.6% |
| Sub-Saharan Africans | 0.0 /100 | #292 | Tragic 42.6% |
| Yuman | 0.0 /100 | #293 | Tragic 42.6% |
| Hondurans | 0.0 /100 | #294 | Tragic 42.5% |
| Immigrants | Western Africa | 0.0 /100 | #295 | Tragic 42.4% |
| Menominee | 0.0 /100 | #296 | Tragic 42.3% |
| Cheyenne | 0.0 /100 | #297 | Tragic 42.2% |
| Immigrants | Honduras | 0.0 /100 | #298 | Tragic 42.2% |