Latvian vs Sudanese Single Father Households
COMPARE
Latvian
Sudanese
Single Father Households
Single Father Households Comparison
Latvians
Sudanese
2.0%
SINGLE FATHER HOUSEHOLDS
100.0/ 100
METRIC RATING
44th/ 347
METRIC RANK
2.4%
SINGLE FATHER HOUSEHOLDS
13.0/ 100
METRIC RATING
219th/ 347
METRIC RANK
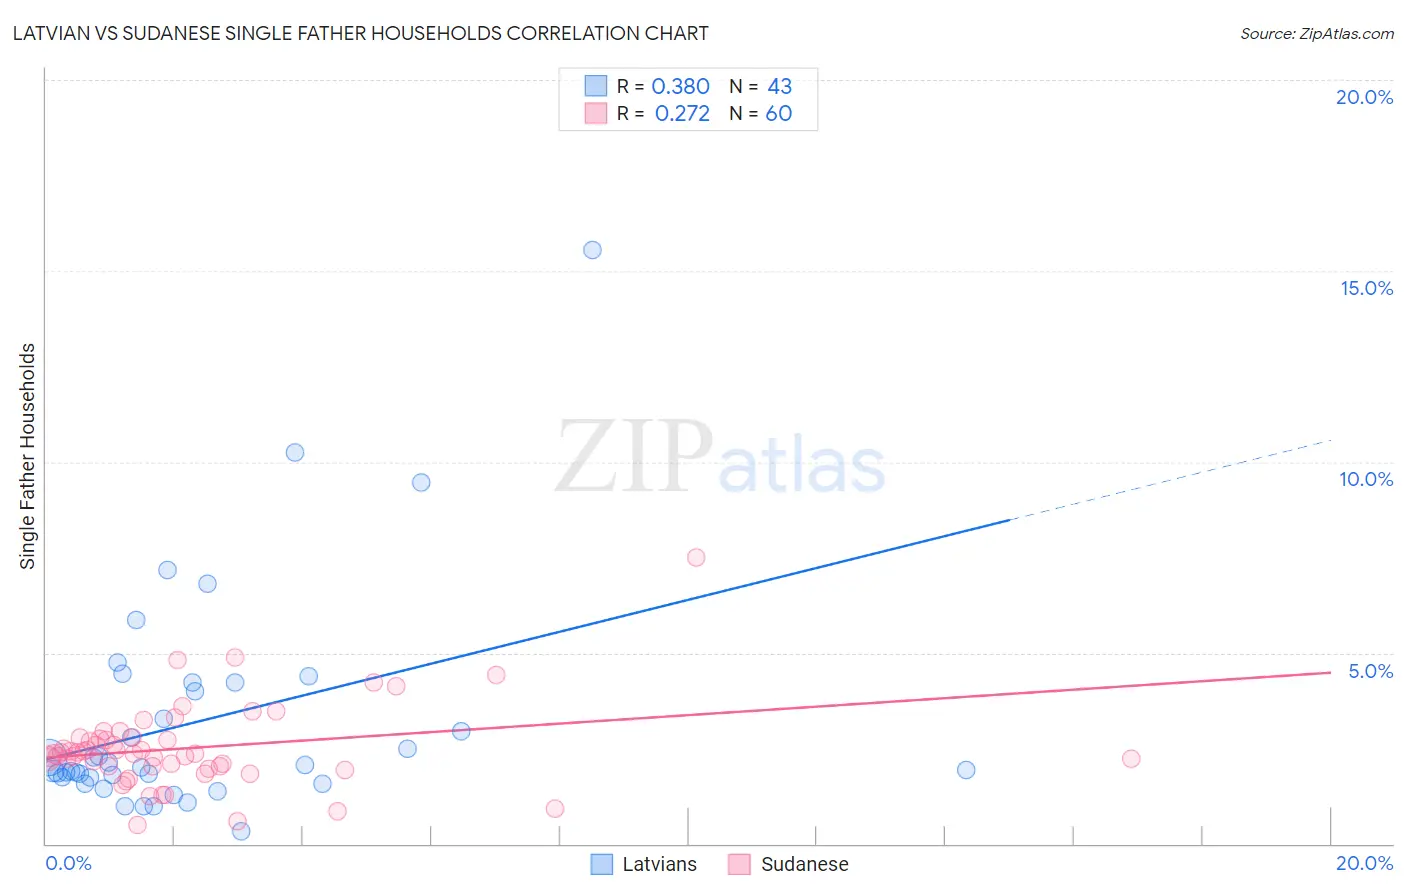
Latvian vs Sudanese Single Father Households Correlation Chart
The statistical analysis conducted on geographies consisting of 219,307,286 people shows a mild positive correlation between the proportion of Latvians and percentage of single father households in the United States with a correlation coefficient (R) of 0.380 and weighted average of 2.0%. Similarly, the statistical analysis conducted on geographies consisting of 109,938,737 people shows a weak positive correlation between the proportion of Sudanese and percentage of single father households in the United States with a correlation coefficient (R) of 0.272 and weighted average of 2.4%, a difference of 20.6%.
Single Father Households Correlation Summary
| Measurement | Latvian | Sudanese |
| Minimum | 0.31% | 0.49% |
| Maximum | 15.6% | 7.5% |
| Range | 15.2% | 7.0% |
| Mean | 3.2% | 2.5% |
| Median | 2.0% | 2.4% |
| Interquartile 25% (IQ1) | 1.7% | 2.0% |
| Interquartile 75% (IQ3) | 4.2% | 2.8% |
| Interquartile Range (IQR) | 2.5% | 0.73% |
| Standard Deviation (Sample) | 2.9% | 1.1% |
| Standard Deviation (Population) | 2.9% | 1.1% |
Similar Demographics by Single Father Households
Demographics Similar to Latvians by Single Father Households
In terms of single father households, the demographic groups most similar to Latvians are Russian (2.0%, a difference of 0.020%), Immigrants from Grenada (2.0%, a difference of 0.090%), Immigrants from Lebanon (2.0%, a difference of 0.12%), Macedonian (2.0%, a difference of 0.31%), and Immigrants from Turkey (2.0%, a difference of 0.46%).
| Demographics | Rating | Rank | Single Father Households |
| Immigrants | St. Vincent and the Grenadines | 100.0 /100 | #37 | Exceptional 2.0% |
| Immigrants | Eastern Europe | 100.0 /100 | #38 | Exceptional 2.0% |
| Immigrants | Sri Lanka | 100.0 /100 | #39 | Exceptional 2.0% |
| Immigrants | Bulgaria | 100.0 /100 | #40 | Exceptional 2.0% |
| Immigrants | Turkey | 100.0 /100 | #41 | Exceptional 2.0% |
| Macedonians | 100.0 /100 | #42 | Exceptional 2.0% |
| Immigrants | Grenada | 100.0 /100 | #43 | Exceptional 2.0% |
| Latvians | 100.0 /100 | #44 | Exceptional 2.0% |
| Russians | 100.0 /100 | #45 | Exceptional 2.0% |
| Immigrants | Lebanon | 100.0 /100 | #46 | Exceptional 2.0% |
| Immigrants | Ukraine | 99.9 /100 | #47 | Exceptional 2.0% |
| Immigrants | Kazakhstan | 99.9 /100 | #48 | Exceptional 2.0% |
| Immigrants | Serbia | 99.9 /100 | #49 | Exceptional 2.0% |
| Immigrants | Switzerland | 99.9 /100 | #50 | Exceptional 2.0% |
| Immigrants | Poland | 99.9 /100 | #51 | Exceptional 2.0% |
Demographics Similar to Sudanese by Single Father Households
In terms of single father households, the demographic groups most similar to Sudanese are Ghanaian (2.4%, a difference of 0.010%), Immigrants from Ethiopia (2.4%, a difference of 0.070%), Immigrants from Burma/Myanmar (2.4%, a difference of 0.14%), Immigrants from Eastern Africa (2.4%, a difference of 0.17%), and Dutch (2.4%, a difference of 0.20%).
| Demographics | Rating | Rank | Single Father Households |
| Finns | 18.3 /100 | #212 | Poor 2.4% |
| Norwegians | 17.1 /100 | #213 | Poor 2.4% |
| Ethiopians | 16.6 /100 | #214 | Poor 2.4% |
| Immigrants | South Eastern Asia | 15.9 /100 | #215 | Poor 2.4% |
| Immigrants | Ecuador | 14.9 /100 | #216 | Poor 2.4% |
| Dutch | 14.3 /100 | #217 | Poor 2.4% |
| Immigrants | Ethiopia | 13.4 /100 | #218 | Poor 2.4% |
| Sudanese | 13.0 /100 | #219 | Poor 2.4% |
| Ghanaians | 12.9 /100 | #220 | Poor 2.4% |
| Immigrants | Burma/Myanmar | 12.1 /100 | #221 | Poor 2.4% |
| Immigrants | Eastern Africa | 11.9 /100 | #222 | Poor 2.4% |
| Immigrants | Uruguay | 11.0 /100 | #223 | Poor 2.4% |
| Immigrants | Bahamas | 10.6 /100 | #224 | Poor 2.4% |
| Marshallese | 9.7 /100 | #225 | Tragic 2.4% |
| Blacks/African Americans | 9.7 /100 | #226 | Tragic 2.4% |