Latvian vs Immigrants from Venezuela Single Father Households
COMPARE
Latvian
Immigrants from Venezuela
Single Father Households
Single Father Households Comparison
Latvians
Immigrants from Venezuela
2.0%
SINGLE FATHER HOUSEHOLDS
100.0/ 100
METRIC RATING
44th/ 347
METRIC RANK
2.3%
SINGLE FATHER HOUSEHOLDS
83.2/ 100
METRIC RATING
152nd/ 347
METRIC RANK
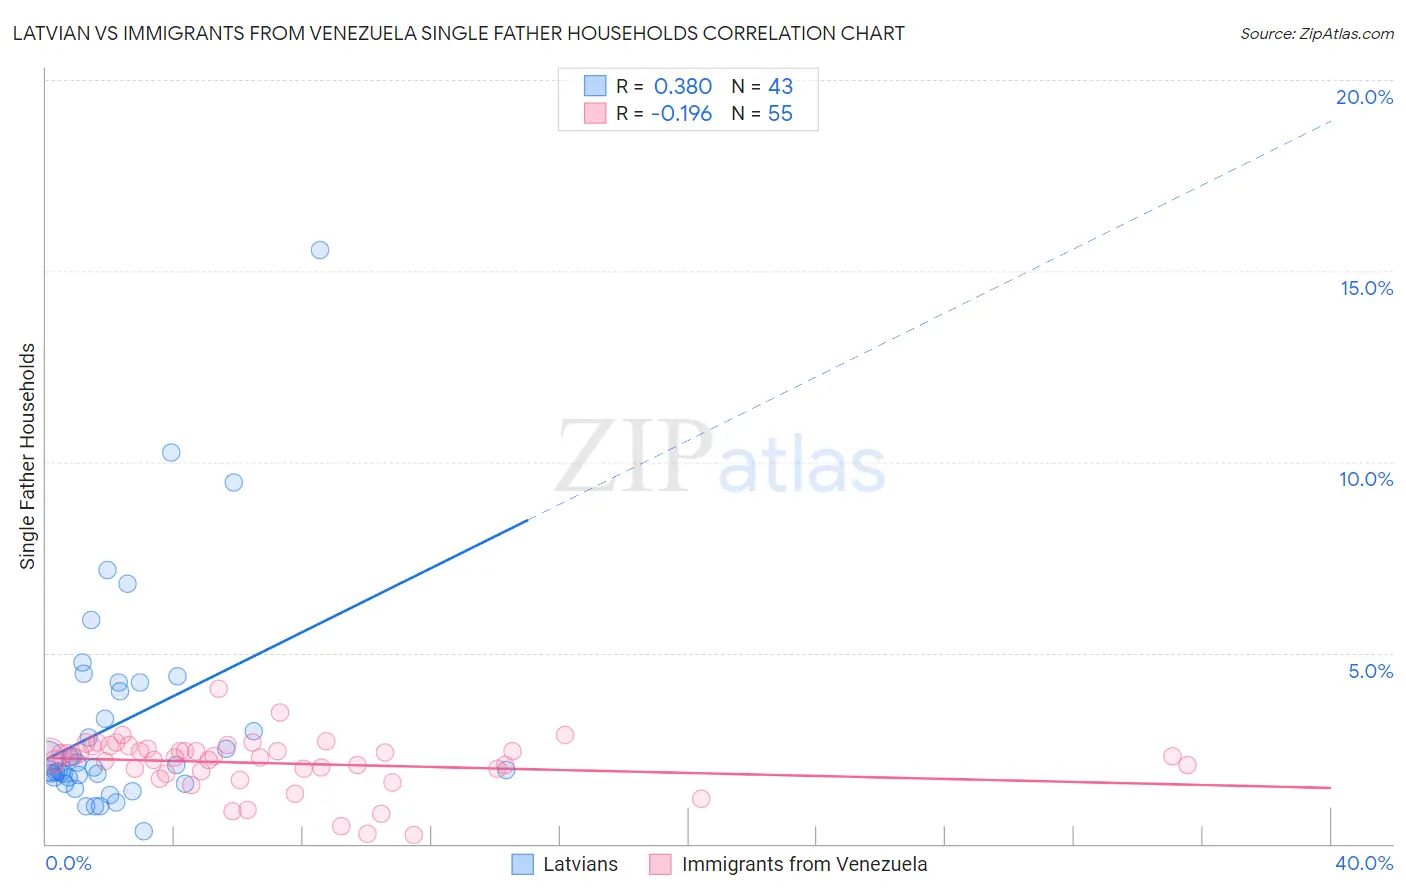
Latvian vs Immigrants from Venezuela Single Father Households Correlation Chart
The statistical analysis conducted on geographies consisting of 219,307,286 people shows a mild positive correlation between the proportion of Latvians and percentage of single father households in the United States with a correlation coefficient (R) of 0.380 and weighted average of 2.0%. Similarly, the statistical analysis conducted on geographies consisting of 286,595,714 people shows a poor negative correlation between the proportion of Immigrants from Venezuela and percentage of single father households in the United States with a correlation coefficient (R) of -0.196 and weighted average of 2.3%, a difference of 13.2%.
Single Father Households Correlation Summary
| Measurement | Latvian | Immigrants from Venezuela |
| Minimum | 0.31% | 0.23% |
| Maximum | 15.6% | 4.1% |
| Range | 15.2% | 3.8% |
| Mean | 3.2% | 2.1% |
| Median | 2.0% | 2.3% |
| Interquartile 25% (IQ1) | 1.7% | 1.9% |
| Interquartile 75% (IQ3) | 4.2% | 2.5% |
| Interquartile Range (IQR) | 2.5% | 0.58% |
| Standard Deviation (Sample) | 2.9% | 0.71% |
| Standard Deviation (Population) | 2.9% | 0.70% |
Similar Demographics by Single Father Households
Demographics Similar to Latvians by Single Father Households
In terms of single father households, the demographic groups most similar to Latvians are Russian (2.0%, a difference of 0.020%), Immigrants from Grenada (2.0%, a difference of 0.090%), Immigrants from Lebanon (2.0%, a difference of 0.12%), Macedonian (2.0%, a difference of 0.31%), and Immigrants from Turkey (2.0%, a difference of 0.46%).
| Demographics | Rating | Rank | Single Father Households |
| Immigrants | St. Vincent and the Grenadines | 100.0 /100 | #37 | Exceptional 2.0% |
| Immigrants | Eastern Europe | 100.0 /100 | #38 | Exceptional 2.0% |
| Immigrants | Sri Lanka | 100.0 /100 | #39 | Exceptional 2.0% |
| Immigrants | Bulgaria | 100.0 /100 | #40 | Exceptional 2.0% |
| Immigrants | Turkey | 100.0 /100 | #41 | Exceptional 2.0% |
| Macedonians | 100.0 /100 | #42 | Exceptional 2.0% |
| Immigrants | Grenada | 100.0 /100 | #43 | Exceptional 2.0% |
| Latvians | 100.0 /100 | #44 | Exceptional 2.0% |
| Russians | 100.0 /100 | #45 | Exceptional 2.0% |
| Immigrants | Lebanon | 100.0 /100 | #46 | Exceptional 2.0% |
| Immigrants | Ukraine | 99.9 /100 | #47 | Exceptional 2.0% |
| Immigrants | Kazakhstan | 99.9 /100 | #48 | Exceptional 2.0% |
| Immigrants | Serbia | 99.9 /100 | #49 | Exceptional 2.0% |
| Immigrants | Switzerland | 99.9 /100 | #50 | Exceptional 2.0% |
| Immigrants | Poland | 99.9 /100 | #51 | Exceptional 2.0% |
Demographics Similar to Immigrants from Venezuela by Single Father Households
In terms of single father households, the demographic groups most similar to Immigrants from Venezuela are Immigrants from Germany (2.3%, a difference of 0.050%), Immigrants from Syria (2.3%, a difference of 0.23%), Bolivian (2.3%, a difference of 0.28%), European (2.3%, a difference of 0.29%), and Immigrants from South America (2.3%, a difference of 0.41%).
| Demographics | Rating | Rank | Single Father Households |
| Immigrants | Zimbabwe | 90.2 /100 | #145 | Exceptional 2.2% |
| Northern Europeans | 89.8 /100 | #146 | Excellent 2.2% |
| Slavs | 88.9 /100 | #147 | Excellent 2.2% |
| South American Indians | 88.5 /100 | #148 | Excellent 2.3% |
| Senegalese | 88.4 /100 | #149 | Excellent 2.3% |
| Venezuelans | 86.2 /100 | #150 | Excellent 2.3% |
| Immigrants | Syria | 84.8 /100 | #151 | Excellent 2.3% |
| Immigrants | Venezuela | 83.2 /100 | #152 | Excellent 2.3% |
| Immigrants | Germany | 82.8 /100 | #153 | Excellent 2.3% |
| Bolivians | 81.0 /100 | #154 | Excellent 2.3% |
| Europeans | 80.9 /100 | #155 | Excellent 2.3% |
| Immigrants | South America | 79.9 /100 | #156 | Good 2.3% |
| Canadians | 79.7 /100 | #157 | Good 2.3% |
| Immigrants | Senegal | 79.4 /100 | #158 | Good 2.3% |
| Immigrants | West Indies | 77.9 /100 | #159 | Good 2.3% |