Immigrants from Ecuador vs Sudanese Single Father Households
COMPARE
Immigrants from Ecuador
Sudanese
Single Father Households
Single Father Households Comparison
Immigrants from Ecuador
Sudanese
2.4%
SINGLE FATHER HOUSEHOLDS
14.9/ 100
METRIC RATING
216th/ 347
METRIC RANK
2.4%
SINGLE FATHER HOUSEHOLDS
13.0/ 100
METRIC RATING
219th/ 347
METRIC RANK
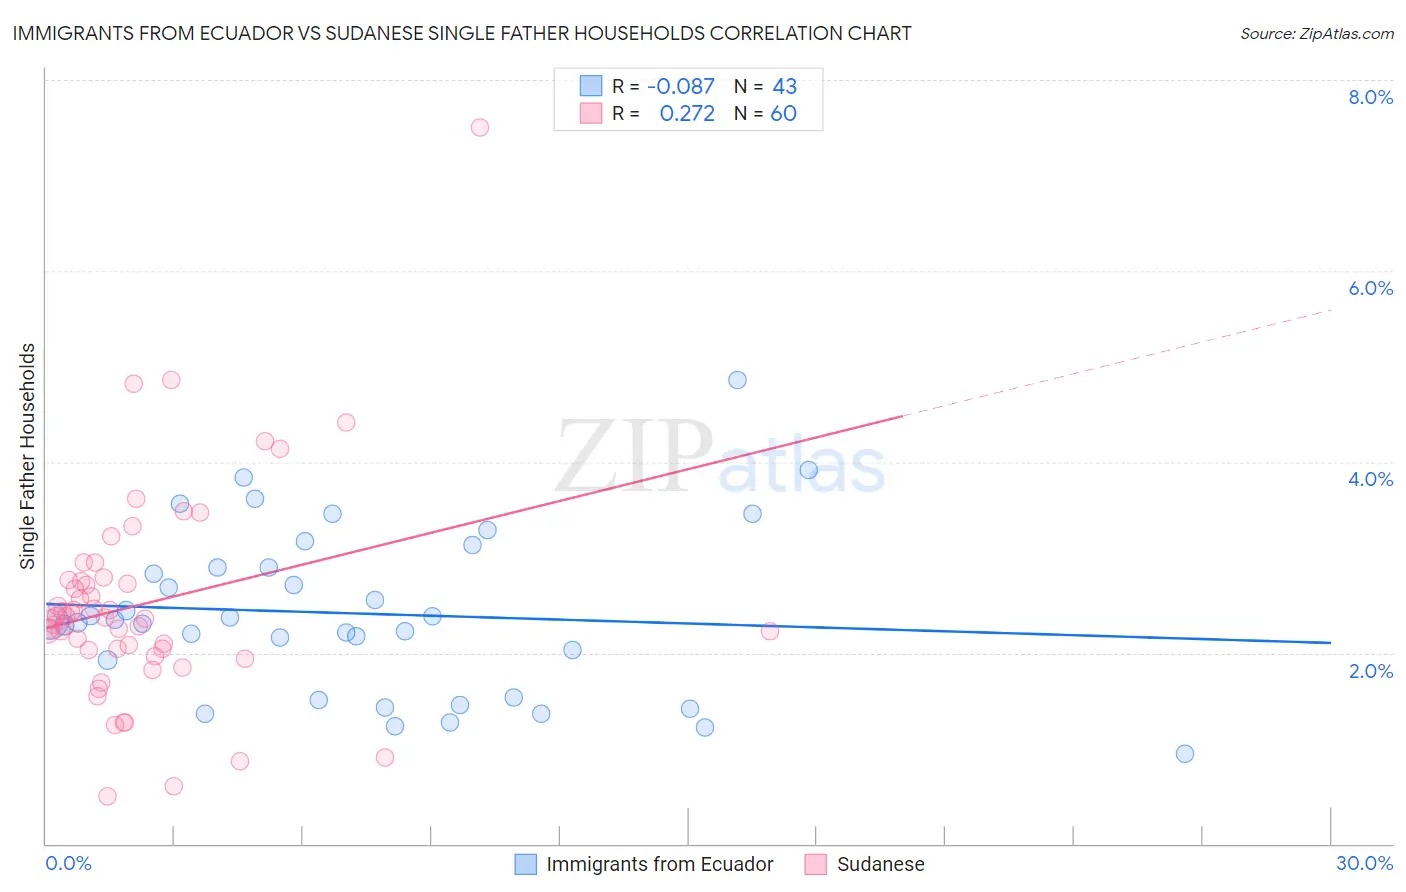
Immigrants from Ecuador vs Sudanese Single Father Households Correlation Chart
The statistical analysis conducted on geographies consisting of 269,379,294 people shows a slight negative correlation between the proportion of Immigrants from Ecuador and percentage of single father households in the United States with a correlation coefficient (R) of -0.087 and weighted average of 2.4%. Similarly, the statistical analysis conducted on geographies consisting of 109,938,737 people shows a weak positive correlation between the proportion of Sudanese and percentage of single father households in the United States with a correlation coefficient (R) of 0.272 and weighted average of 2.4%, a difference of 0.29%.
Single Father Households Correlation Summary
| Measurement | Immigrants from Ecuador | Sudanese |
| Minimum | 0.94% | 0.49% |
| Maximum | 4.9% | 7.5% |
| Range | 3.9% | 7.0% |
| Mean | 2.4% | 2.5% |
| Median | 2.3% | 2.4% |
| Interquartile 25% (IQ1) | 1.5% | 2.0% |
| Interquartile 75% (IQ3) | 2.9% | 2.8% |
| Interquartile Range (IQR) | 1.4% | 0.73% |
| Standard Deviation (Sample) | 0.87% | 1.1% |
| Standard Deviation (Population) | 0.86% | 1.1% |
Demographics Similar to Immigrants from Ecuador and Sudanese by Single Father Households
In terms of single father households, the demographic groups most similar to Immigrants from Ecuador are Dutch (2.4%, a difference of 0.090%), Immigrants from South Eastern Asia (2.4%, a difference of 0.13%), Immigrants from Ethiopia (2.4%, a difference of 0.22%), Ethiopian (2.4%, a difference of 0.23%), and Norwegian (2.4%, a difference of 0.29%). Similarly, the demographic groups most similar to Sudanese are Ghanaian (2.4%, a difference of 0.010%), Immigrants from Ethiopia (2.4%, a difference of 0.070%), Immigrants from Burma/Myanmar (2.4%, a difference of 0.14%), Immigrants from Eastern Africa (2.4%, a difference of 0.17%), and Dutch (2.4%, a difference of 0.20%).
| Demographics | Rating | Rank | Single Father Households |
| Whites/Caucasians | 22.6 /100 | #207 | Fair 2.4% |
| Immigrants | Kenya | 20.3 /100 | #208 | Fair 2.4% |
| Immigrants | Peru | 19.3 /100 | #209 | Poor 2.4% |
| Immigrants | Costa Rica | 19.2 /100 | #210 | Poor 2.4% |
| Immigrants | Nigeria | 18.7 /100 | #211 | Poor 2.4% |
| Finns | 18.3 /100 | #212 | Poor 2.4% |
| Norwegians | 17.1 /100 | #213 | Poor 2.4% |
| Ethiopians | 16.6 /100 | #214 | Poor 2.4% |
| Immigrants | South Eastern Asia | 15.9 /100 | #215 | Poor 2.4% |
| Immigrants | Ecuador | 14.9 /100 | #216 | Poor 2.4% |
| Dutch | 14.3 /100 | #217 | Poor 2.4% |
| Immigrants | Ethiopia | 13.4 /100 | #218 | Poor 2.4% |
| Sudanese | 13.0 /100 | #219 | Poor 2.4% |
| Ghanaians | 12.9 /100 | #220 | Poor 2.4% |
| Immigrants | Burma/Myanmar | 12.1 /100 | #221 | Poor 2.4% |
| Immigrants | Eastern Africa | 11.9 /100 | #222 | Poor 2.4% |
| Immigrants | Uruguay | 11.0 /100 | #223 | Poor 2.4% |
| Immigrants | Bahamas | 10.6 /100 | #224 | Poor 2.4% |
| Marshallese | 9.7 /100 | #225 | Tragic 2.4% |
| Blacks/African Americans | 9.7 /100 | #226 | Tragic 2.4% |
| Americans | 9.3 /100 | #227 | Tragic 2.4% |