Latvian vs Armenian Single Father Households
COMPARE
Latvian
Armenian
Single Father Households
Single Father Households Comparison
Latvians
Armenians
2.0%
SINGLE FATHER HOUSEHOLDS
100.0/ 100
METRIC RATING
44th/ 347
METRIC RANK
2.1%
SINGLE FATHER HOUSEHOLDS
99.7/ 100
METRIC RATING
81st/ 347
METRIC RANK
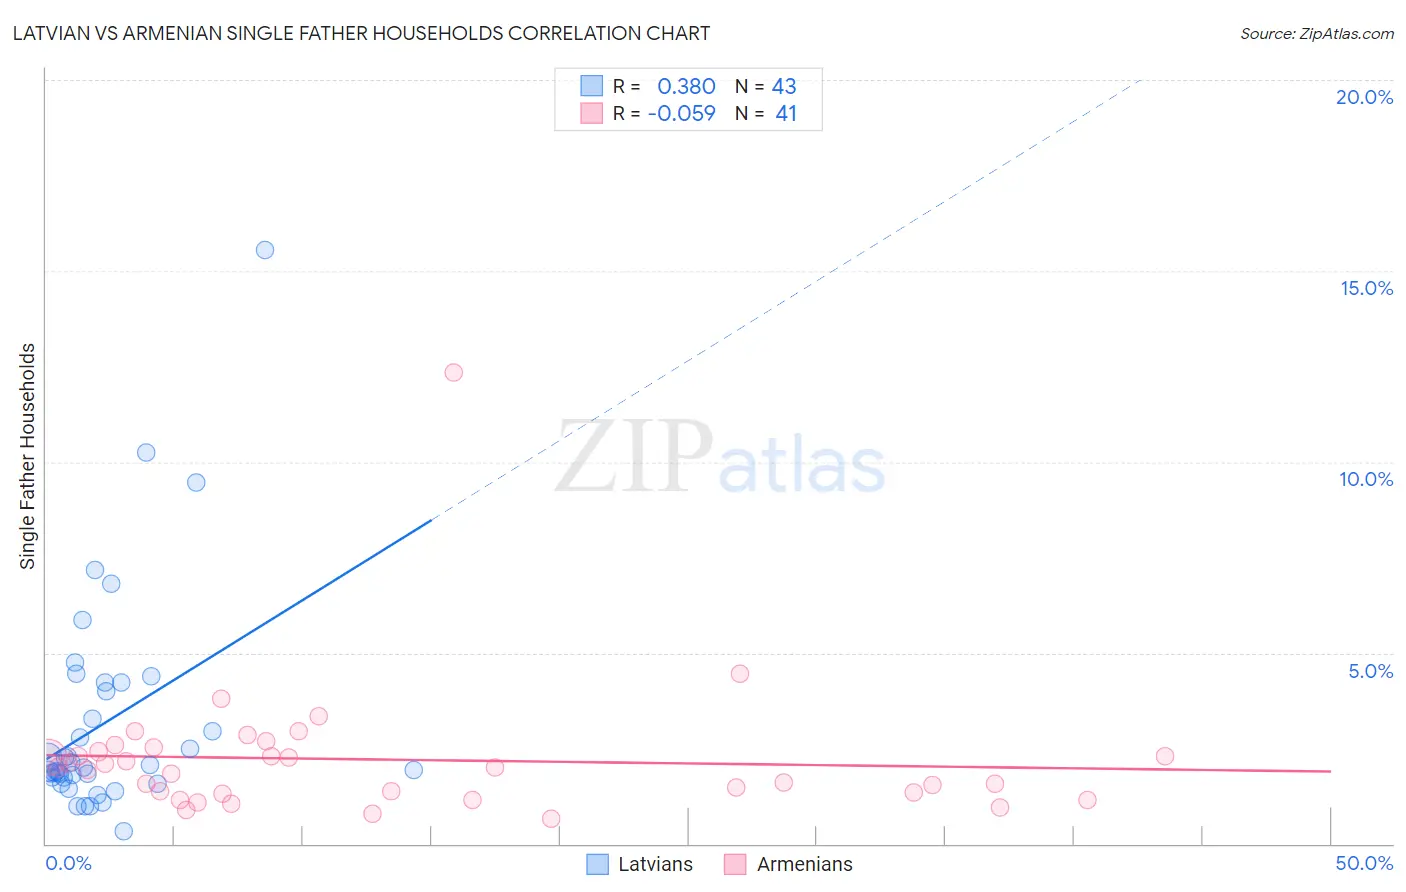
Latvian vs Armenian Single Father Households Correlation Chart
The statistical analysis conducted on geographies consisting of 219,307,286 people shows a mild positive correlation between the proportion of Latvians and percentage of single father households in the United States with a correlation coefficient (R) of 0.380 and weighted average of 2.0%. Similarly, the statistical analysis conducted on geographies consisting of 308,570,699 people shows a slight negative correlation between the proportion of Armenians and percentage of single father households in the United States with a correlation coefficient (R) of -0.059 and weighted average of 2.1%, a difference of 4.2%.
Single Father Households Correlation Summary
| Measurement | Latvian | Armenian |
| Minimum | 0.31% | 0.66% |
| Maximum | 15.6% | 12.3% |
| Range | 15.2% | 11.7% |
| Mean | 3.2% | 2.2% |
| Median | 2.0% | 2.0% |
| Interquartile 25% (IQ1) | 1.7% | 1.3% |
| Interquartile 75% (IQ3) | 4.2% | 2.5% |
| Interquartile Range (IQR) | 2.5% | 1.1% |
| Standard Deviation (Sample) | 2.9% | 1.8% |
| Standard Deviation (Population) | 2.9% | 1.8% |
Similar Demographics by Single Father Households
Demographics Similar to Latvians by Single Father Households
In terms of single father households, the demographic groups most similar to Latvians are Russian (2.0%, a difference of 0.020%), Immigrants from Grenada (2.0%, a difference of 0.090%), Immigrants from Lebanon (2.0%, a difference of 0.12%), Macedonian (2.0%, a difference of 0.31%), and Immigrants from Turkey (2.0%, a difference of 0.46%).
| Demographics | Rating | Rank | Single Father Households |
| Immigrants | St. Vincent and the Grenadines | 100.0 /100 | #37 | Exceptional 2.0% |
| Immigrants | Eastern Europe | 100.0 /100 | #38 | Exceptional 2.0% |
| Immigrants | Sri Lanka | 100.0 /100 | #39 | Exceptional 2.0% |
| Immigrants | Bulgaria | 100.0 /100 | #40 | Exceptional 2.0% |
| Immigrants | Turkey | 100.0 /100 | #41 | Exceptional 2.0% |
| Macedonians | 100.0 /100 | #42 | Exceptional 2.0% |
| Immigrants | Grenada | 100.0 /100 | #43 | Exceptional 2.0% |
| Latvians | 100.0 /100 | #44 | Exceptional 2.0% |
| Russians | 100.0 /100 | #45 | Exceptional 2.0% |
| Immigrants | Lebanon | 100.0 /100 | #46 | Exceptional 2.0% |
| Immigrants | Ukraine | 99.9 /100 | #47 | Exceptional 2.0% |
| Immigrants | Kazakhstan | 99.9 /100 | #48 | Exceptional 2.0% |
| Immigrants | Serbia | 99.9 /100 | #49 | Exceptional 2.0% |
| Immigrants | Switzerland | 99.9 /100 | #50 | Exceptional 2.0% |
| Immigrants | Poland | 99.9 /100 | #51 | Exceptional 2.0% |
Demographics Similar to Armenians by Single Father Households
In terms of single father households, the demographic groups most similar to Armenians are New Zealander (2.1%, a difference of 0.050%), Greek (2.1%, a difference of 0.060%), Immigrants from South Africa (2.1%, a difference of 0.080%), Immigrants from Asia (2.1%, a difference of 0.17%), and Estonian (2.1%, a difference of 0.28%).
| Demographics | Rating | Rank | Single Father Households |
| Immigrants | Egypt | 99.8 /100 | #74 | Exceptional 2.1% |
| Immigrants | Sweden | 99.8 /100 | #75 | Exceptional 2.1% |
| Immigrants | Scotland | 99.8 /100 | #76 | Exceptional 2.1% |
| Immigrants | Saudi Arabia | 99.8 /100 | #77 | Exceptional 2.1% |
| Estonians | 99.7 /100 | #78 | Exceptional 2.1% |
| Immigrants | Asia | 99.7 /100 | #79 | Exceptional 2.1% |
| Immigrants | South Africa | 99.7 /100 | #80 | Exceptional 2.1% |
| Armenians | 99.7 /100 | #81 | Exceptional 2.1% |
| New Zealanders | 99.7 /100 | #82 | Exceptional 2.1% |
| Greeks | 99.7 /100 | #83 | Exceptional 2.1% |
| Carpatho Rusyns | 99.6 /100 | #84 | Exceptional 2.1% |
| Immigrants | Hungary | 99.6 /100 | #85 | Exceptional 2.1% |
| Asians | 99.6 /100 | #86 | Exceptional 2.1% |
| Lithuanians | 99.5 /100 | #87 | Exceptional 2.1% |
| Bhutanese | 99.5 /100 | #88 | Exceptional 2.1% |