Latvian vs Sudanese In Labor Force | Age 20-64
COMPARE
Latvian
Sudanese
In Labor Force | Age 20-64
In Labor Force | Age 20-64 Comparison
Latvians
Sudanese
80.5%
IN LABOR FORCE | AGE 20-64
99.8/ 100
METRIC RATING
42nd/ 347
METRIC RANK
80.8%
IN LABOR FORCE | AGE 20-64
100.0/ 100
METRIC RATING
22nd/ 347
METRIC RANK
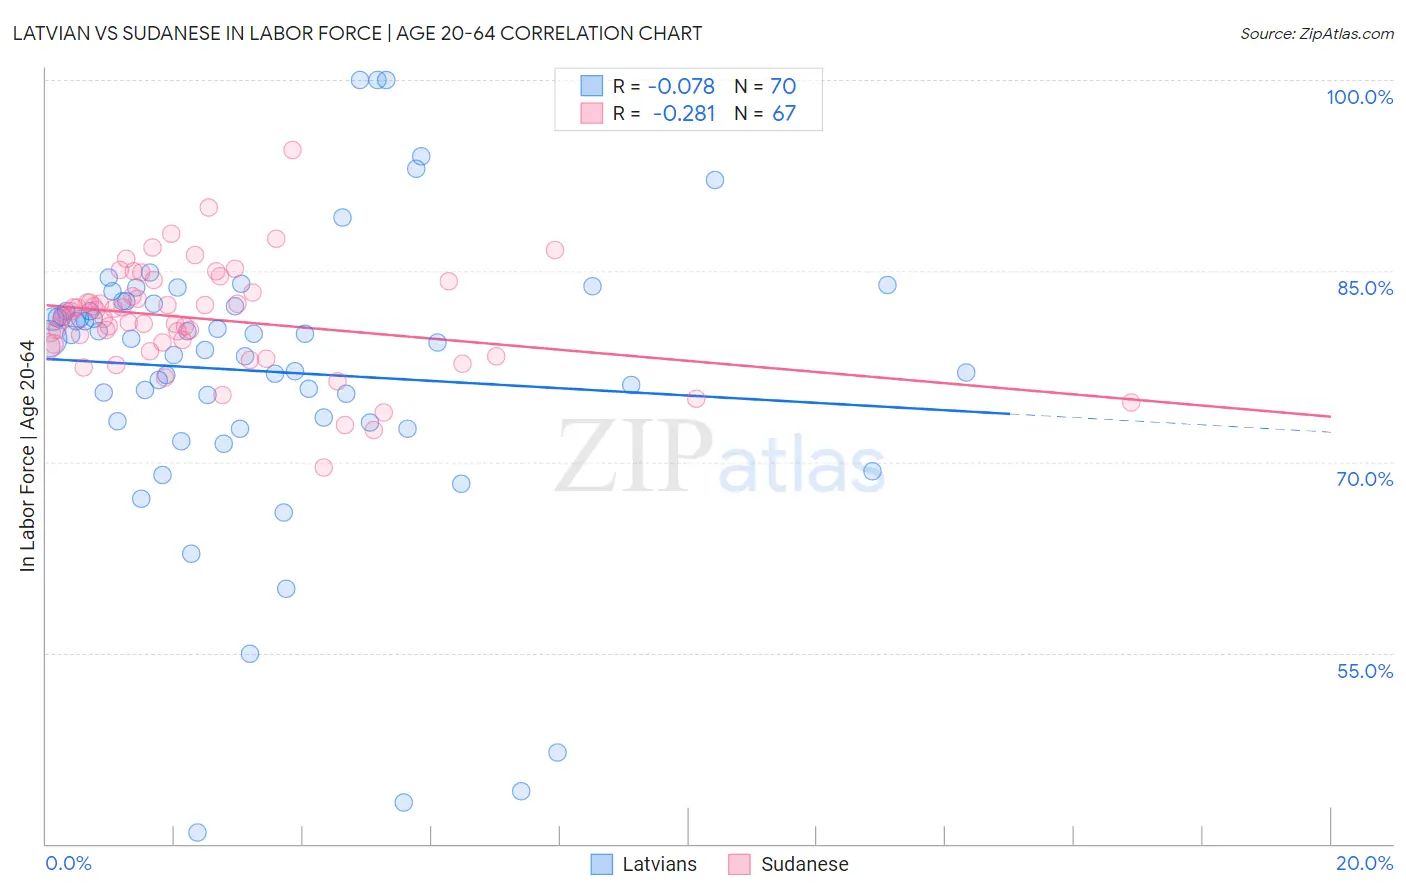
Latvian vs Sudanese In Labor Force | Age 20-64 Correlation Chart
The statistical analysis conducted on geographies consisting of 220,728,272 people shows a slight negative correlation between the proportion of Latvians and labor force participation rate among population between the ages 20 and 64 in the United States with a correlation coefficient (R) of -0.078 and weighted average of 80.5%. Similarly, the statistical analysis conducted on geographies consisting of 110,143,017 people shows a weak negative correlation between the proportion of Sudanese and labor force participation rate among population between the ages 20 and 64 in the United States with a correlation coefficient (R) of -0.281 and weighted average of 80.8%, a difference of 0.40%.
In Labor Force | Age 20-64 Correlation Summary
| Measurement | Latvian | Sudanese |
| Minimum | 40.9% | 69.6% |
| Maximum | 100.0% | 94.5% |
| Range | 59.1% | 24.9% |
| Mean | 77.1% | 81.2% |
| Median | 79.7% | 81.4% |
| Interquartile 25% (IQ1) | 73.2% | 79.1% |
| Interquartile 75% (IQ3) | 82.4% | 83.3% |
| Interquartile Range (IQR) | 9.2% | 4.2% |
| Standard Deviation (Sample) | 11.6% | 4.2% |
| Standard Deviation (Population) | 11.5% | 4.2% |
Demographics Similar to Latvians and Sudanese by In Labor Force | Age 20-64
In terms of in labor force | age 20-64, the demographic groups most similar to Latvians are Immigrants from Liberia (80.5%, a difference of 0.020%), Brazilian (80.5%, a difference of 0.030%), Immigrants from Zimbabwe (80.5%, a difference of 0.030%), Ugandan (80.6%, a difference of 0.040%), and Paraguayan (80.6%, a difference of 0.060%). Similarly, the demographic groups most similar to Sudanese are Immigrants from Bosnia and Herzegovina (80.8%, a difference of 0.0%), Immigrants from Morocco (80.8%, a difference of 0.020%), Kenyan (80.8%, a difference of 0.030%), Immigrants from Serbia (80.8%, a difference of 0.050%), and Immigrants from Kenya (80.7%, a difference of 0.12%).
| Demographics | Rating | Rank | In Labor Force | Age 20-64 |
| Sudanese | 100.0 /100 | #22 | Exceptional 80.8% |
| Immigrants | Bosnia and Herzegovina | 100.0 /100 | #23 | Exceptional 80.8% |
| Immigrants | Morocco | 100.0 /100 | #24 | Exceptional 80.8% |
| Kenyans | 100.0 /100 | #25 | Exceptional 80.8% |
| Immigrants | Serbia | 100.0 /100 | #26 | Exceptional 80.8% |
| Immigrants | Kenya | 99.9 /100 | #27 | Exceptional 80.7% |
| Immigrants | Uganda | 99.9 /100 | #28 | Exceptional 80.7% |
| Immigrants | South Central Asia | 99.9 /100 | #29 | Exceptional 80.7% |
| Immigrants | North Macedonia | 99.9 /100 | #30 | Exceptional 80.7% |
| Immigrants | Lithuania | 99.9 /100 | #31 | Exceptional 80.7% |
| Immigrants | Ireland | 99.9 /100 | #32 | Exceptional 80.7% |
| Chinese | 99.9 /100 | #33 | Exceptional 80.7% |
| Immigrants | Brazil | 99.9 /100 | #34 | Exceptional 80.7% |
| Immigrants | Poland | 99.9 /100 | #35 | Exceptional 80.6% |
| Paraguayans | 99.8 /100 | #36 | Exceptional 80.6% |
| Immigrants | Moldova | 99.8 /100 | #37 | Exceptional 80.6% |
| Ugandans | 99.8 /100 | #38 | Exceptional 80.6% |
| Brazilians | 99.8 /100 | #39 | Exceptional 80.5% |
| Immigrants | Zimbabwe | 99.8 /100 | #40 | Exceptional 80.5% |
| Immigrants | Liberia | 99.8 /100 | #41 | Exceptional 80.5% |
| Latvians | 99.8 /100 | #42 | Exceptional 80.5% |