Latvian vs Immigrants from Western Europe Single Father Households
COMPARE
Latvian
Immigrants from Western Europe
Single Father Households
Single Father Households Comparison
Latvians
Immigrants from Western Europe
2.0%
SINGLE FATHER HOUSEHOLDS
100.0/ 100
METRIC RATING
44th/ 347
METRIC RANK
2.1%
SINGLE FATHER HOUSEHOLDS
98.9/ 100
METRIC RATING
101st/ 347
METRIC RANK
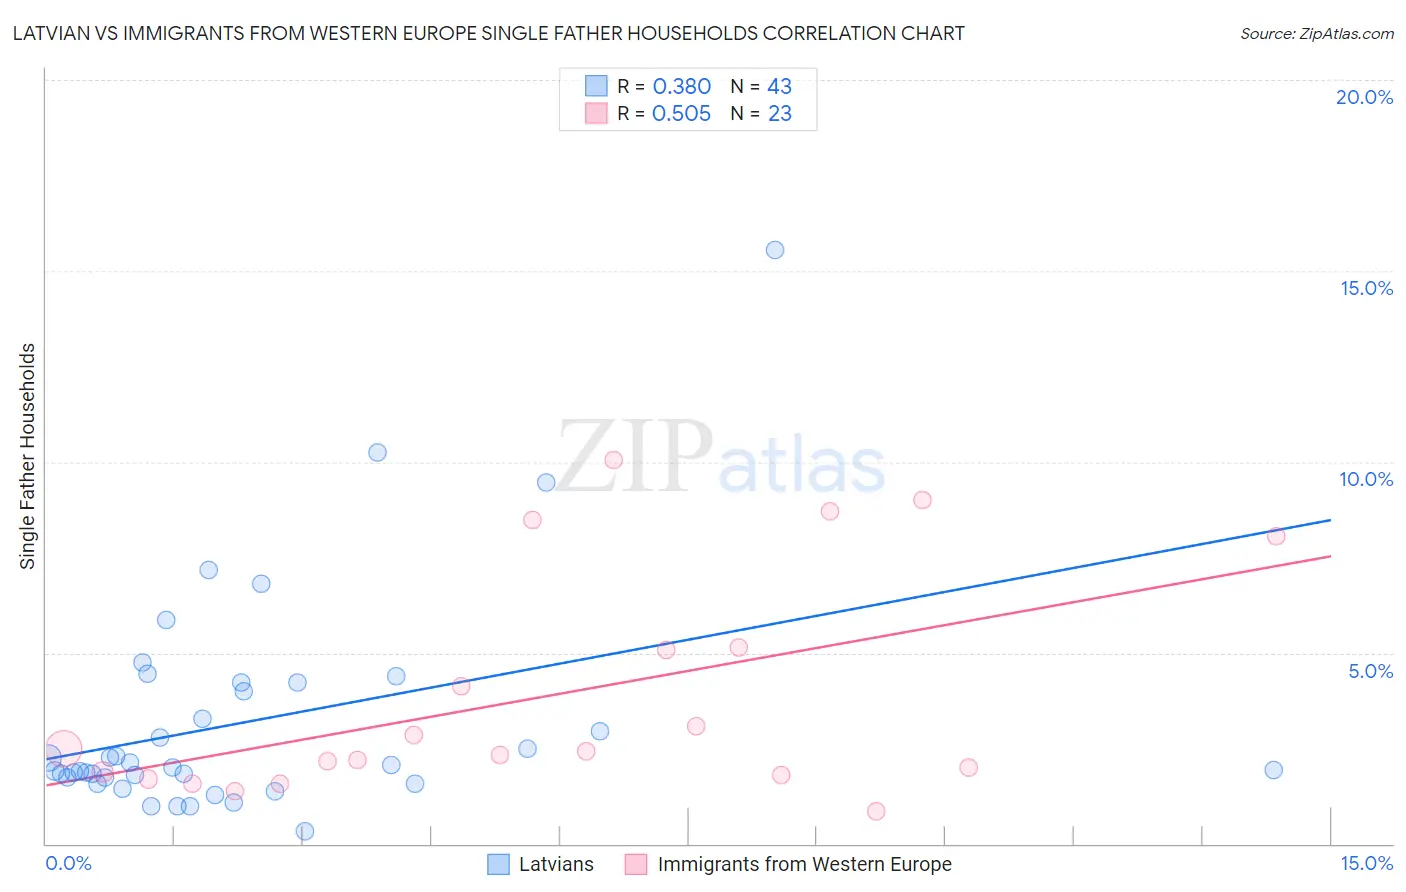
Latvian vs Immigrants from Western Europe Single Father Households Correlation Chart
The statistical analysis conducted on geographies consisting of 219,307,286 people shows a mild positive correlation between the proportion of Latvians and percentage of single father households in the United States with a correlation coefficient (R) of 0.380 and weighted average of 2.0%. Similarly, the statistical analysis conducted on geographies consisting of 486,889,765 people shows a substantial positive correlation between the proportion of Immigrants from Western Europe and percentage of single father households in the United States with a correlation coefficient (R) of 0.505 and weighted average of 2.1%, a difference of 6.9%.
Single Father Households Correlation Summary
| Measurement | Latvian | Immigrants from Western Europe |
| Minimum | 0.31% | 0.84% |
| Maximum | 15.6% | 10.0% |
| Range | 15.2% | 9.2% |
| Mean | 3.2% | 3.9% |
| Median | 2.0% | 2.4% |
| Interquartile 25% (IQ1) | 1.7% | 1.8% |
| Interquartile 75% (IQ3) | 4.2% | 5.1% |
| Interquartile Range (IQR) | 2.5% | 3.3% |
| Standard Deviation (Sample) | 2.9% | 2.9% |
| Standard Deviation (Population) | 2.9% | 2.8% |
Similar Demographics by Single Father Households
Demographics Similar to Latvians by Single Father Households
In terms of single father households, the demographic groups most similar to Latvians are Russian (2.0%, a difference of 0.020%), Immigrants from Grenada (2.0%, a difference of 0.090%), Immigrants from Lebanon (2.0%, a difference of 0.12%), Macedonian (2.0%, a difference of 0.31%), and Immigrants from Turkey (2.0%, a difference of 0.46%).
| Demographics | Rating | Rank | Single Father Households |
| Immigrants | St. Vincent and the Grenadines | 100.0 /100 | #37 | Exceptional 2.0% |
| Immigrants | Eastern Europe | 100.0 /100 | #38 | Exceptional 2.0% |
| Immigrants | Sri Lanka | 100.0 /100 | #39 | Exceptional 2.0% |
| Immigrants | Bulgaria | 100.0 /100 | #40 | Exceptional 2.0% |
| Immigrants | Turkey | 100.0 /100 | #41 | Exceptional 2.0% |
| Macedonians | 100.0 /100 | #42 | Exceptional 2.0% |
| Immigrants | Grenada | 100.0 /100 | #43 | Exceptional 2.0% |
| Latvians | 100.0 /100 | #44 | Exceptional 2.0% |
| Russians | 100.0 /100 | #45 | Exceptional 2.0% |
| Immigrants | Lebanon | 100.0 /100 | #46 | Exceptional 2.0% |
| Immigrants | Ukraine | 99.9 /100 | #47 | Exceptional 2.0% |
| Immigrants | Kazakhstan | 99.9 /100 | #48 | Exceptional 2.0% |
| Immigrants | Serbia | 99.9 /100 | #49 | Exceptional 2.0% |
| Immigrants | Switzerland | 99.9 /100 | #50 | Exceptional 2.0% |
| Immigrants | Poland | 99.9 /100 | #51 | Exceptional 2.0% |
Demographics Similar to Immigrants from Western Europe by Single Father Households
In terms of single father households, the demographic groups most similar to Immigrants from Western Europe are Argentinean (2.1%, a difference of 0.030%), Lebanese (2.1%, a difference of 0.050%), Alsatian (2.1%, a difference of 0.070%), Immigrants from Northern Africa (2.1%, a difference of 0.15%), and South African (2.1%, a difference of 0.30%).
| Demographics | Rating | Rank | Single Father Households |
| Ukrainians | 99.3 /100 | #94 | Exceptional 2.1% |
| Bermudans | 99.2 /100 | #95 | Exceptional 2.1% |
| Arabs | 99.2 /100 | #96 | Exceptional 2.1% |
| Immigrants | Moldova | 99.1 /100 | #97 | Exceptional 2.1% |
| Guyanese | 99.1 /100 | #98 | Exceptional 2.1% |
| South Africans | 99.1 /100 | #99 | Exceptional 2.1% |
| Immigrants | Northern Africa | 99.0 /100 | #100 | Exceptional 2.1% |
| Immigrants | Western Europe | 98.9 /100 | #101 | Exceptional 2.1% |
| Argentineans | 98.9 /100 | #102 | Exceptional 2.1% |
| Lebanese | 98.9 /100 | #103 | Exceptional 2.1% |
| Alsatians | 98.9 /100 | #104 | Exceptional 2.1% |
| Palestinians | 98.6 /100 | #105 | Exceptional 2.2% |
| Immigrants | Southern Europe | 98.6 /100 | #106 | Exceptional 2.2% |
| Slovenes | 98.5 /100 | #107 | Exceptional 2.2% |
| Immigrants | Netherlands | 98.5 /100 | #108 | Exceptional 2.2% |