Latvian vs Immigrants from Kenya Disability Age 18 to 34
COMPARE
Latvian
Immigrants from Kenya
Disability Age 18 to 34
Disability Age 18 to 34 Comparison
Latvians
Immigrants from Kenya
6.8%
DISABILITY AGE 18 TO 34
11.1/ 100
METRIC RATING
210th/ 347
METRIC RANK
6.9%
DISABILITY AGE 18 TO 34
6.9/ 100
METRIC RATING
217th/ 347
METRIC RANK
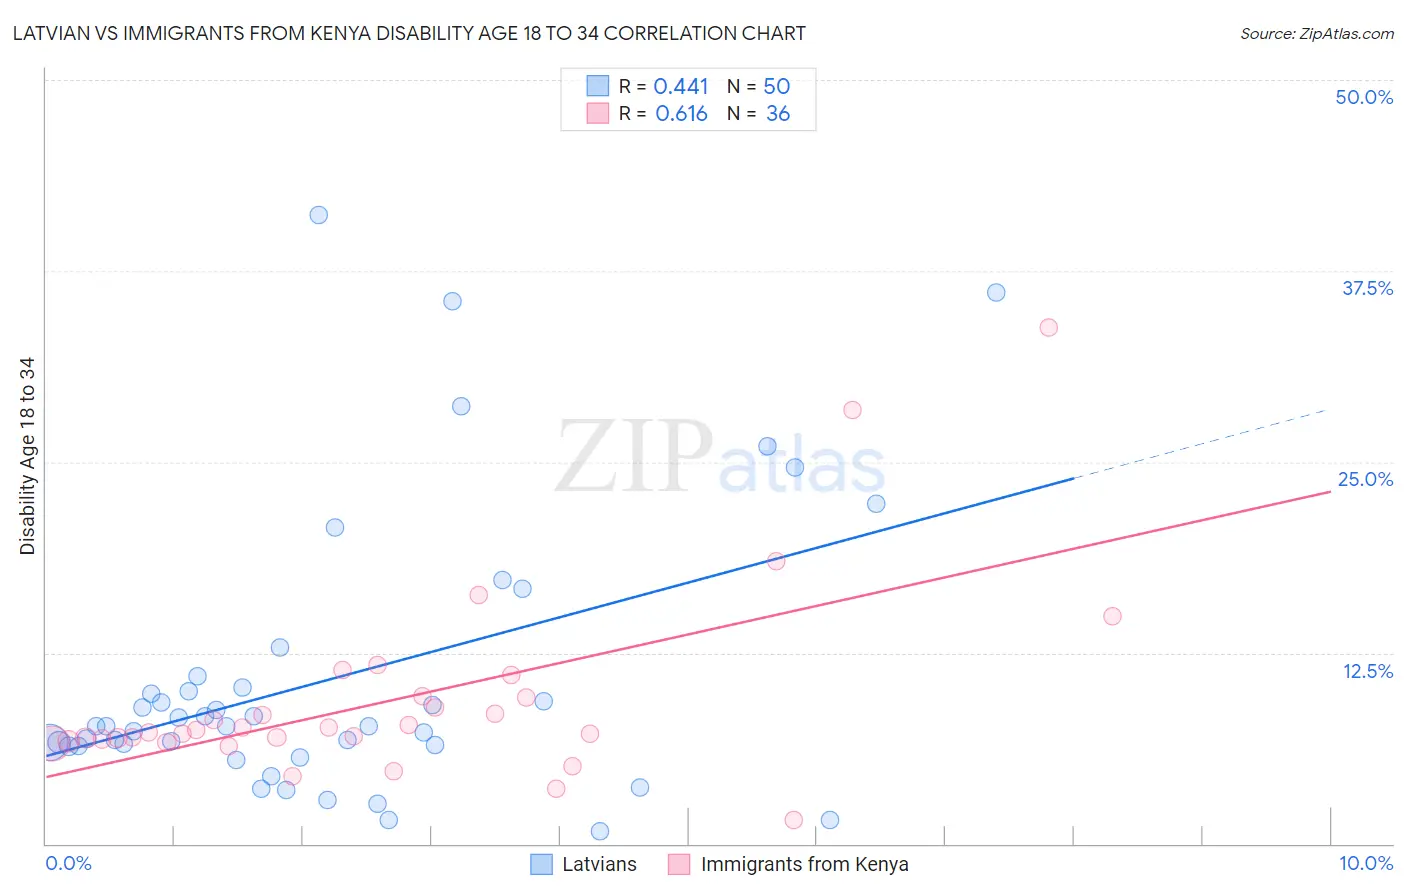
Latvian vs Immigrants from Kenya Disability Age 18 to 34 Correlation Chart
The statistical analysis conducted on geographies consisting of 220,392,708 people shows a moderate positive correlation between the proportion of Latvians and percentage of population with a disability between the ages 18 and 35 in the United States with a correlation coefficient (R) of 0.441 and weighted average of 6.8%. Similarly, the statistical analysis conducted on geographies consisting of 217,952,306 people shows a significant positive correlation between the proportion of Immigrants from Kenya and percentage of population with a disability between the ages 18 and 35 in the United States with a correlation coefficient (R) of 0.616 and weighted average of 6.9%, a difference of 0.86%.
Disability Age 18 to 34 Correlation Summary
| Measurement | Latvian | Immigrants from Kenya |
| Minimum | 0.83% | 1.5% |
| Maximum | 41.2% | 33.8% |
| Range | 40.3% | 32.3% |
| Mean | 10.8% | 9.4% |
| Median | 7.7% | 7.4% |
| Interquartile 25% (IQ1) | 6.4% | 6.8% |
| Interquartile 75% (IQ3) | 10.2% | 9.6% |
| Interquartile Range (IQR) | 3.8% | 2.8% |
| Standard Deviation (Sample) | 9.2% | 6.3% |
| Standard Deviation (Population) | 9.1% | 6.2% |
Demographics Similar to Latvians and Immigrants from Kenya by Disability Age 18 to 34
In terms of disability age 18 to 34, the demographic groups most similar to Latvians are Immigrants from Burma/Myanmar (6.8%, a difference of 0.20%), Immigrants from Norway (6.8%, a difference of 0.20%), Immigrants from Scotland (6.8%, a difference of 0.22%), Mexican (6.8%, a difference of 0.24%), and Japanese (6.8%, a difference of 0.27%). Similarly, the demographic groups most similar to Immigrants from Kenya are Sudanese (6.9%, a difference of 0.020%), Ukrainian (6.9%, a difference of 0.050%), Hawaiian (6.9%, a difference of 0.12%), Immigrants from Thailand (6.9%, a difference of 0.15%), and Serbian (6.9%, a difference of 0.31%).
| Demographics | Rating | Rank | Disability Age 18 to 34 |
| Hispanics or Latinos | 13.8 /100 | #203 | Poor 6.8% |
| Immigrants | Bosnia and Herzegovina | 13.6 /100 | #204 | Poor 6.8% |
| Lebanese | 13.3 /100 | #205 | Poor 6.8% |
| Japanese | 12.8 /100 | #206 | Poor 6.8% |
| Mexicans | 12.6 /100 | #207 | Poor 6.8% |
| Immigrants | Scotland | 12.4 /100 | #208 | Poor 6.8% |
| Immigrants | Burma/Myanmar | 12.3 /100 | #209 | Poor 6.8% |
| Latvians | 11.1 /100 | #210 | Poor 6.8% |
| Immigrants | Norway | 10.0 /100 | #211 | Tragic 6.8% |
| Luxembourgers | 9.4 /100 | #212 | Tragic 6.9% |
| Immigrants | Western Europe | 9.1 /100 | #213 | Tragic 6.9% |
| Serbians | 8.2 /100 | #214 | Tragic 6.9% |
| Immigrants | Thailand | 7.5 /100 | #215 | Tragic 6.9% |
| Sudanese | 7.0 /100 | #216 | Tragic 6.9% |
| Immigrants | Kenya | 6.9 /100 | #217 | Tragic 6.9% |
| Ukrainians | 6.7 /100 | #218 | Tragic 6.9% |
| Hawaiians | 6.5 /100 | #219 | Tragic 6.9% |
| Immigrants | Senegal | 5.5 /100 | #220 | Tragic 6.9% |
| Immigrants | Middle Africa | 5.5 /100 | #221 | Tragic 6.9% |
| Immigrants | England | 5.3 /100 | #222 | Tragic 6.9% |
| Carpatho Rusyns | 5.2 /100 | #223 | Tragic 6.9% |