Latvian vs Immigrants from Central America Currently Married
COMPARE
Latvian
Immigrants from Central America
Currently Married
Currently Married Comparison
Latvians
Immigrants from Central America
48.5%
CURRENTLY MARRIED
98.7/ 100
METRIC RATING
56th/ 347
METRIC RANK
44.1%
CURRENTLY MARRIED
0.3/ 100
METRIC RATING
253rd/ 347
METRIC RANK
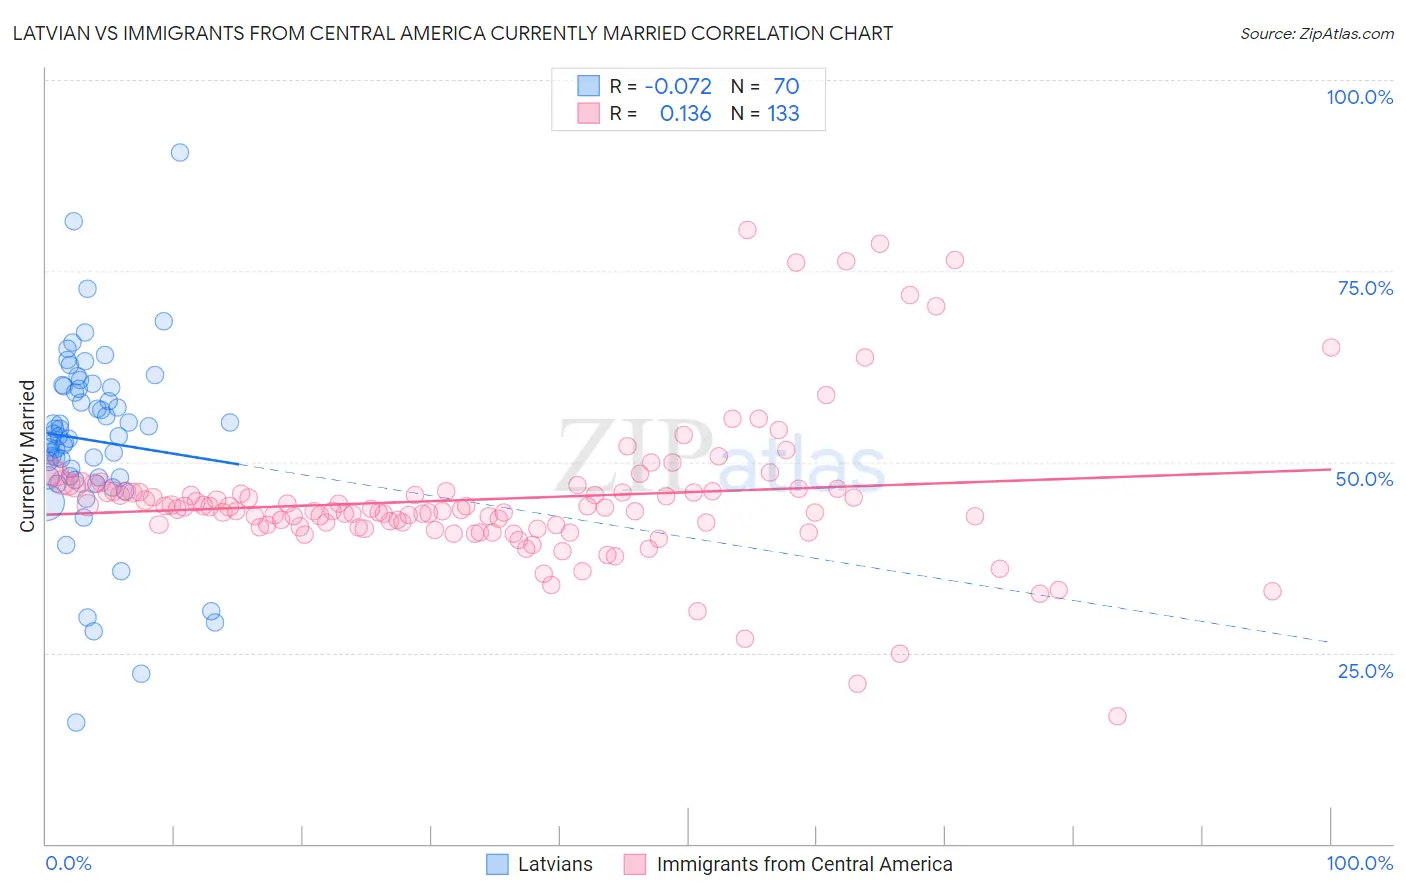
Latvian vs Immigrants from Central America Currently Married Correlation Chart
The statistical analysis conducted on geographies consisting of 220,695,418 people shows a slight negative correlation between the proportion of Latvians and percentage of population currently married in the United States with a correlation coefficient (R) of -0.072 and weighted average of 48.5%. Similarly, the statistical analysis conducted on geographies consisting of 536,454,573 people shows a poor positive correlation between the proportion of Immigrants from Central America and percentage of population currently married in the United States with a correlation coefficient (R) of 0.136 and weighted average of 44.1%, a difference of 9.8%.
Currently Married Correlation Summary
| Measurement | Latvian | Immigrants from Central America |
| Minimum | 15.8% | 16.7% |
| Maximum | 90.5% | 80.4% |
| Range | 74.7% | 63.7% |
| Mean | 52.8% | 45.1% |
| Median | 53.4% | 43.8% |
| Interquartile 25% (IQ1) | 47.9% | 41.5% |
| Interquartile 75% (IQ3) | 59.7% | 46.2% |
| Interquartile Range (IQR) | 11.8% | 4.7% |
| Standard Deviation (Sample) | 12.1% | 9.6% |
| Standard Deviation (Population) | 12.0% | 9.5% |
Similar Demographics by Currently Married
Demographics Similar to Latvians by Currently Married
In terms of currently married, the demographic groups most similar to Latvians are Immigrants from Moldova (48.5%, a difference of 0.0%), Immigrants from North Macedonia (48.5%, a difference of 0.0%), Immigrants from Netherlands (48.5%, a difference of 0.030%), Immigrants from Austria (48.5%, a difference of 0.070%), and French (48.4%, a difference of 0.070%).
| Demographics | Rating | Rank | Currently Married |
| Bhutanese | 99.1 /100 | #49 | Exceptional 48.6% |
| Iranians | 99.0 /100 | #50 | Exceptional 48.6% |
| Whites/Caucasians | 99.0 /100 | #51 | Exceptional 48.6% |
| Russians | 98.9 /100 | #52 | Exceptional 48.6% |
| Immigrants | Austria | 98.8 /100 | #53 | Exceptional 48.5% |
| Immigrants | Moldova | 98.7 /100 | #54 | Exceptional 48.5% |
| Immigrants | North Macedonia | 98.7 /100 | #55 | Exceptional 48.5% |
| Latvians | 98.7 /100 | #56 | Exceptional 48.5% |
| Immigrants | Netherlands | 98.6 /100 | #57 | Exceptional 48.5% |
| French | 98.6 /100 | #58 | Exceptional 48.4% |
| Immigrants | Ireland | 98.5 /100 | #59 | Exceptional 48.4% |
| Immigrants | Romania | 98.5 /100 | #60 | Exceptional 48.4% |
| Romanians | 98.5 /100 | #61 | Exceptional 48.4% |
| Asians | 98.5 /100 | #62 | Exceptional 48.4% |
| Slavs | 98.3 /100 | #63 | Exceptional 48.4% |
Demographics Similar to Immigrants from Central America by Currently Married
In terms of currently married, the demographic groups most similar to Immigrants from Central America are Hispanic or Latino (44.1%, a difference of 0.030%), Blackfeet (44.2%, a difference of 0.050%), Immigrants from Eastern Africa (44.2%, a difference of 0.12%), Immigrants from Cameroon (44.2%, a difference of 0.14%), and Nicaraguan (44.2%, a difference of 0.15%).
| Demographics | Rating | Rank | Currently Married |
| Immigrants | Burma/Myanmar | 0.4 /100 | #246 | Tragic 44.3% |
| Ugandans | 0.4 /100 | #247 | Tragic 44.2% |
| Nicaraguans | 0.3 /100 | #248 | Tragic 44.2% |
| Immigrants | Cameroon | 0.3 /100 | #249 | Tragic 44.2% |
| Immigrants | Eastern Africa | 0.3 /100 | #250 | Tragic 44.2% |
| Blackfeet | 0.3 /100 | #251 | Tragic 44.2% |
| Hispanics or Latinos | 0.3 /100 | #252 | Tragic 44.1% |
| Immigrants | Central America | 0.3 /100 | #253 | Tragic 44.1% |
| Vietnamese | 0.2 /100 | #254 | Tragic 44.0% |
| Yakama | 0.2 /100 | #255 | Tragic 44.0% |
| Shoshone | 0.2 /100 | #256 | Tragic 44.0% |
| Immigrants | Africa | 0.2 /100 | #257 | Tragic 43.9% |
| Ute | 0.2 /100 | #258 | Tragic 43.9% |
| Immigrants | Sierra Leone | 0.1 /100 | #259 | Tragic 43.8% |
| Immigrants | Latin America | 0.1 /100 | #260 | Tragic 43.8% |