Latvian vs Immigrants from Kenya 9th Grade
COMPARE
Latvian
Immigrants from Kenya
9th Grade
9th Grade Comparison
Latvians
Immigrants from Kenya
96.4%
9TH GRADE
100.0/ 100
METRIC RATING
24th/ 347
METRIC RANK
95.0%
9TH GRADE
73.1/ 100
METRIC RATING
156th/ 347
METRIC RANK
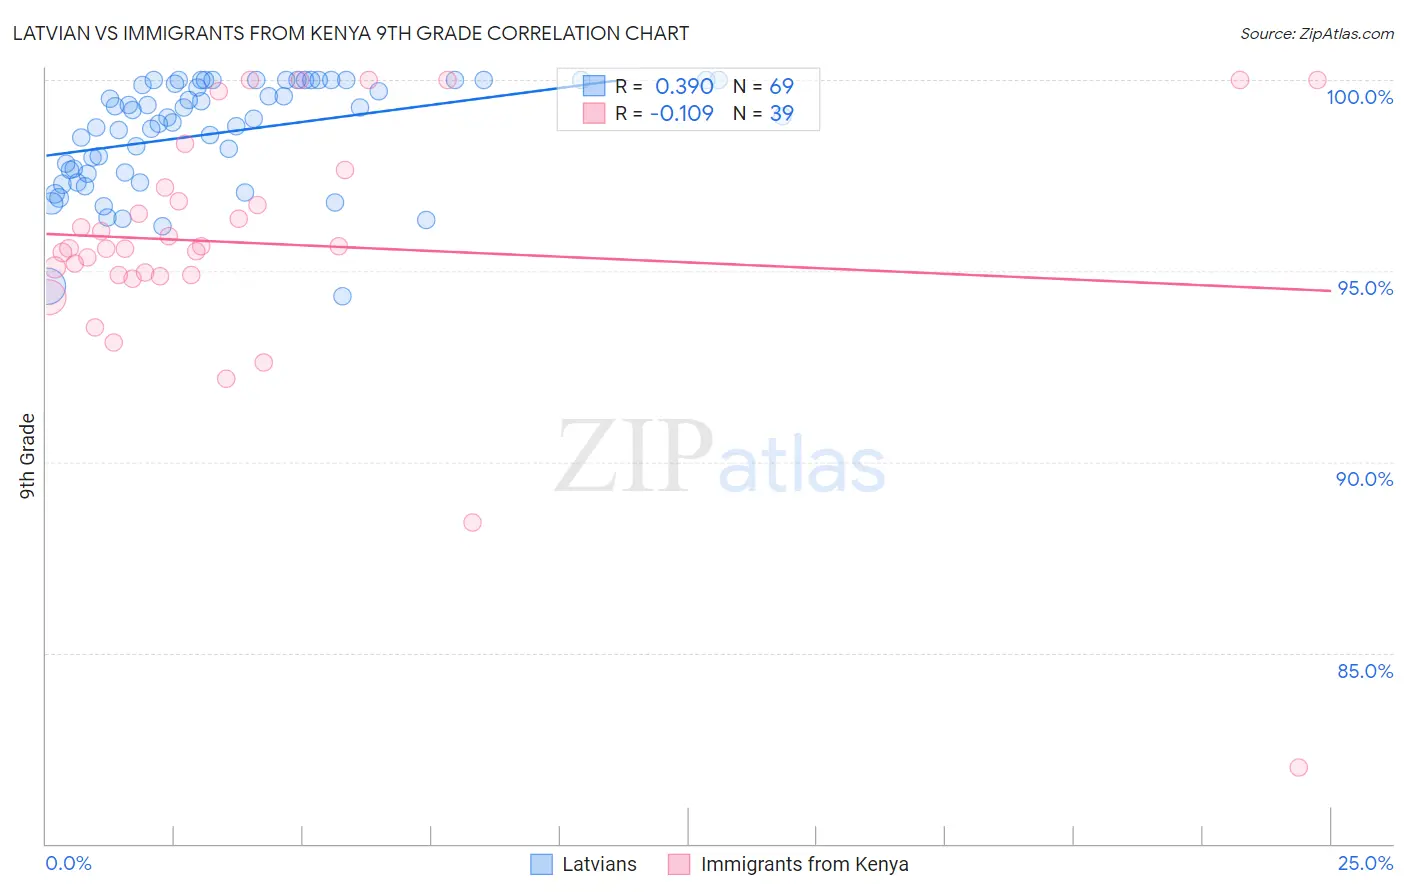
Latvian vs Immigrants from Kenya 9th Grade Correlation Chart
The statistical analysis conducted on geographies consisting of 220,726,265 people shows a mild positive correlation between the proportion of Latvians and percentage of population with at least 9th grade education in the United States with a correlation coefficient (R) of 0.390 and weighted average of 96.4%. Similarly, the statistical analysis conducted on geographies consisting of 218,076,690 people shows a poor negative correlation between the proportion of Immigrants from Kenya and percentage of population with at least 9th grade education in the United States with a correlation coefficient (R) of -0.109 and weighted average of 95.0%, a difference of 1.4%.
9th Grade Correlation Summary
| Measurement | Latvian | Immigrants from Kenya |
| Minimum | 94.4% | 82.0% |
| Maximum | 100.0% | 100.0% |
| Range | 5.6% | 18.0% |
| Mean | 98.6% | 95.7% |
| Median | 99.0% | 95.6% |
| Interquartile 25% (IQ1) | 97.6% | 94.9% |
| Interquartile 75% (IQ3) | 100.0% | 97.2% |
| Interquartile Range (IQR) | 2.4% | 2.3% |
| Standard Deviation (Sample) | 1.4% | 3.3% |
| Standard Deviation (Population) | 1.4% | 3.3% |
Similar Demographics by 9th Grade
Demographics Similar to Latvians by 9th Grade
In terms of 9th grade, the demographic groups most similar to Latvians are French (96.3%, a difference of 0.010%), Czech (96.4%, a difference of 0.030%), European (96.4%, a difference of 0.040%), French Canadian (96.3%, a difference of 0.040%), and Alaskan Athabascan (96.4%, a difference of 0.050%).
| Demographics | Rating | Rank | 9th Grade |
| Dutch | 100.0 /100 | #17 | Exceptional 96.5% |
| Scandinavians | 100.0 /100 | #18 | Exceptional 96.5% |
| Welsh | 100.0 /100 | #19 | Exceptional 96.4% |
| Italians | 100.0 /100 | #20 | Exceptional 96.4% |
| Alaskan Athabascans | 100.0 /100 | #21 | Exceptional 96.4% |
| Europeans | 100.0 /100 | #22 | Exceptional 96.4% |
| Czechs | 100.0 /100 | #23 | Exceptional 96.4% |
| Latvians | 100.0 /100 | #24 | Exceptional 96.4% |
| French | 100.0 /100 | #25 | Exceptional 96.3% |
| French Canadians | 100.0 /100 | #26 | Exceptional 96.3% |
| Scotch-Irish | 100.0 /100 | #27 | Exceptional 96.3% |
| Eastern Europeans | 100.0 /100 | #28 | Exceptional 96.3% |
| Chinese | 100.0 /100 | #29 | Exceptional 96.3% |
| Maltese | 100.0 /100 | #30 | Exceptional 96.3% |
| British | 100.0 /100 | #31 | Exceptional 96.3% |
Demographics Similar to Immigrants from Kenya by 9th Grade
In terms of 9th grade, the demographic groups most similar to Immigrants from Kenya are Mongolian (95.0%, a difference of 0.0%), Arab (95.1%, a difference of 0.020%), Immigrants from Kazakhstan (95.1%, a difference of 0.020%), Albanian (95.1%, a difference of 0.030%), and Egyptian (95.0%, a difference of 0.030%).
| Demographics | Rating | Rank | 9th Grade |
| Immigrants | Korea | 79.6 /100 | #149 | Good 95.1% |
| Kenyans | 79.1 /100 | #150 | Good 95.1% |
| Cajuns | 77.3 /100 | #151 | Good 95.1% |
| Ugandans | 77.0 /100 | #152 | Good 95.1% |
| Albanians | 76.1 /100 | #153 | Good 95.1% |
| Arabs | 74.9 /100 | #154 | Good 95.1% |
| Immigrants | Kazakhstan | 74.7 /100 | #155 | Good 95.1% |
| Immigrants | Kenya | 73.1 /100 | #156 | Good 95.0% |
| Mongolians | 73.0 /100 | #157 | Good 95.0% |
| Egyptians | 70.1 /100 | #158 | Good 95.0% |
| Immigrants | Ukraine | 67.4 /100 | #159 | Good 95.0% |
| Immigrants | Italy | 66.6 /100 | #160 | Good 95.0% |
| French American Indians | 66.5 /100 | #161 | Good 95.0% |
| Bermudans | 65.8 /100 | #162 | Good 95.0% |
| Pakistanis | 64.1 /100 | #163 | Good 95.0% |