Latvian vs Icelander Currently Married
COMPARE
Latvian
Icelander
Currently Married
Currently Married Comparison
Latvians
Icelanders
48.5%
CURRENTLY MARRIED
98.7/ 100
METRIC RATING
56th/ 347
METRIC RANK
47.3%
CURRENTLY MARRIED
82.4/ 100
METRIC RATING
131st/ 347
METRIC RANK
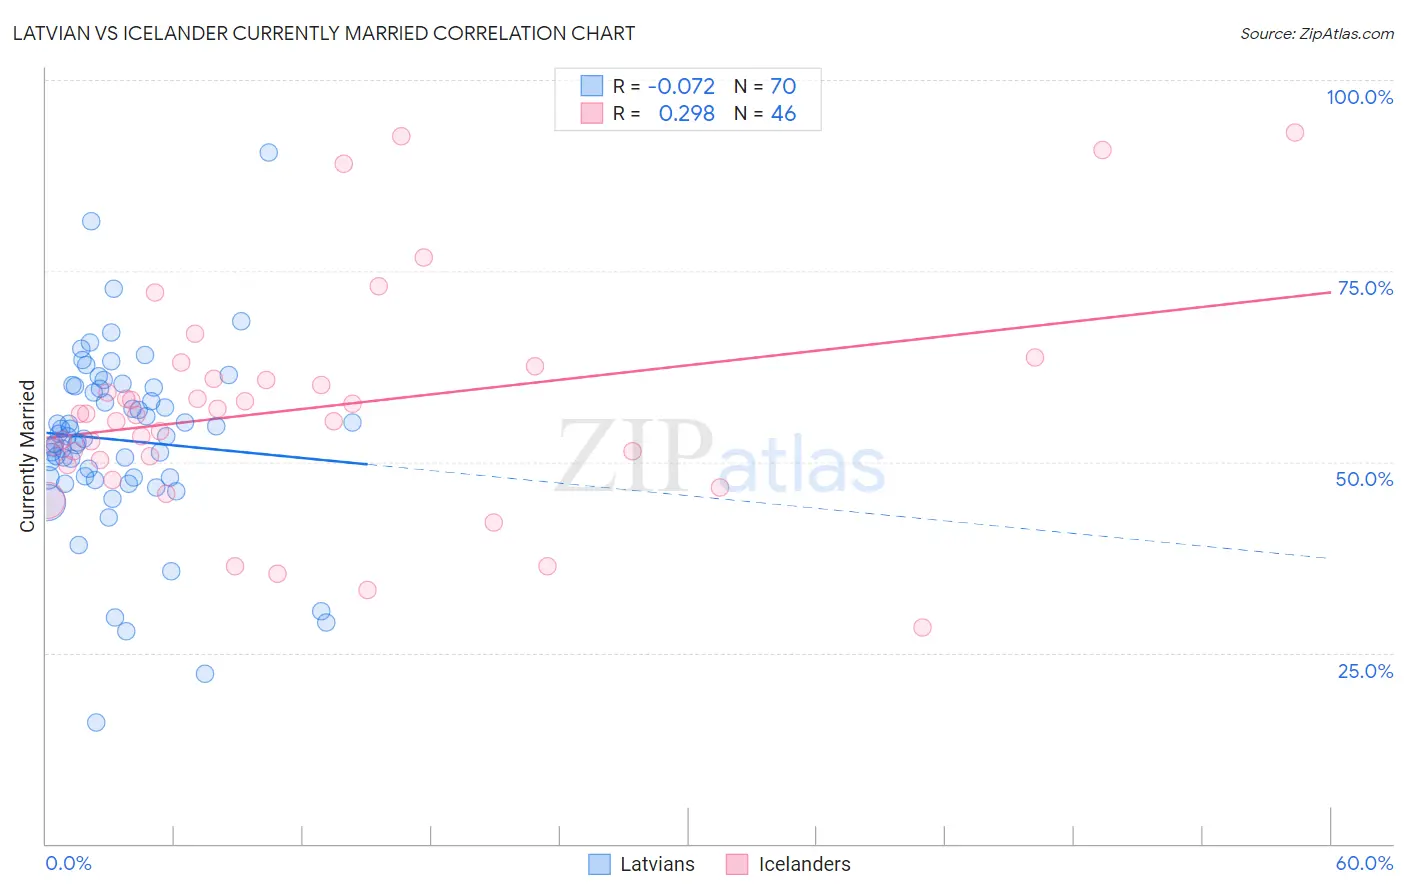
Latvian vs Icelander Currently Married Correlation Chart
The statistical analysis conducted on geographies consisting of 220,695,418 people shows a slight negative correlation between the proportion of Latvians and percentage of population currently married in the United States with a correlation coefficient (R) of -0.072 and weighted average of 48.5%. Similarly, the statistical analysis conducted on geographies consisting of 159,647,895 people shows a weak positive correlation between the proportion of Icelanders and percentage of population currently married in the United States with a correlation coefficient (R) of 0.298 and weighted average of 47.3%, a difference of 2.5%.
Currently Married Correlation Summary
| Measurement | Latvian | Icelander |
| Minimum | 15.8% | 28.3% |
| Maximum | 90.5% | 93.2% |
| Range | 74.7% | 64.9% |
| Mean | 52.8% | 57.1% |
| Median | 53.4% | 56.2% |
| Interquartile 25% (IQ1) | 47.9% | 50.3% |
| Interquartile 75% (IQ3) | 59.7% | 60.9% |
| Interquartile Range (IQR) | 11.8% | 10.6% |
| Standard Deviation (Sample) | 12.1% | 14.6% |
| Standard Deviation (Population) | 12.0% | 14.4% |
Similar Demographics by Currently Married
Demographics Similar to Latvians by Currently Married
In terms of currently married, the demographic groups most similar to Latvians are Immigrants from Moldova (48.5%, a difference of 0.0%), Immigrants from North Macedonia (48.5%, a difference of 0.0%), Immigrants from Netherlands (48.5%, a difference of 0.030%), Immigrants from Austria (48.5%, a difference of 0.070%), and French (48.4%, a difference of 0.070%).
| Demographics | Rating | Rank | Currently Married |
| Bhutanese | 99.1 /100 | #49 | Exceptional 48.6% |
| Iranians | 99.0 /100 | #50 | Exceptional 48.6% |
| Whites/Caucasians | 99.0 /100 | #51 | Exceptional 48.6% |
| Russians | 98.9 /100 | #52 | Exceptional 48.6% |
| Immigrants | Austria | 98.8 /100 | #53 | Exceptional 48.5% |
| Immigrants | Moldova | 98.7 /100 | #54 | Exceptional 48.5% |
| Immigrants | North Macedonia | 98.7 /100 | #55 | Exceptional 48.5% |
| Latvians | 98.7 /100 | #56 | Exceptional 48.5% |
| Immigrants | Netherlands | 98.6 /100 | #57 | Exceptional 48.5% |
| French | 98.6 /100 | #58 | Exceptional 48.4% |
| Immigrants | Ireland | 98.5 /100 | #59 | Exceptional 48.4% |
| Immigrants | Romania | 98.5 /100 | #60 | Exceptional 48.4% |
| Romanians | 98.5 /100 | #61 | Exceptional 48.4% |
| Asians | 98.5 /100 | #62 | Exceptional 48.4% |
| Slavs | 98.3 /100 | #63 | Exceptional 48.4% |
Demographics Similar to Icelanders by Currently Married
In terms of currently married, the demographic groups most similar to Icelanders are Immigrants from Iraq (47.3%, a difference of 0.020%), Afghan (47.3%, a difference of 0.040%), Sri Lankan (47.3%, a difference of 0.050%), Immigrants from Malaysia (47.3%, a difference of 0.080%), and Immigrants from Australia (47.3%, a difference of 0.080%).
| Demographics | Rating | Rank | Currently Married |
| Laotians | 86.6 /100 | #124 | Excellent 47.4% |
| Okinawans | 85.3 /100 | #125 | Excellent 47.4% |
| Immigrants | Jordan | 84.9 /100 | #126 | Excellent 47.4% |
| New Zealanders | 84.9 /100 | #127 | Excellent 47.4% |
| Portuguese | 84.2 /100 | #128 | Excellent 47.3% |
| Sri Lankans | 83.2 /100 | #129 | Excellent 47.3% |
| Immigrants | Iraq | 82.8 /100 | #130 | Excellent 47.3% |
| Icelanders | 82.4 /100 | #131 | Excellent 47.3% |
| Afghans | 81.8 /100 | #132 | Excellent 47.3% |
| Immigrants | Malaysia | 81.1 /100 | #133 | Excellent 47.3% |
| Immigrants | Australia | 81.1 /100 | #134 | Excellent 47.3% |
| Immigrants | Norway | 79.7 /100 | #135 | Good 47.2% |
| Immigrants | Vietnam | 78.2 /100 | #136 | Good 47.2% |
| Paraguayans | 77.8 /100 | #137 | Good 47.2% |
| Pakistanis | 77.5 /100 | #138 | Good 47.2% |