Latvian vs Immigrants from Fiji Currently Married
COMPARE
Latvian
Immigrants from Fiji
Currently Married
Currently Married Comparison
Latvians
Immigrants from Fiji
48.5%
CURRENTLY MARRIED
98.7/ 100
METRIC RATING
56th/ 347
METRIC RANK
46.2%
CURRENTLY MARRIED
25.0/ 100
METRIC RATING
193rd/ 347
METRIC RANK
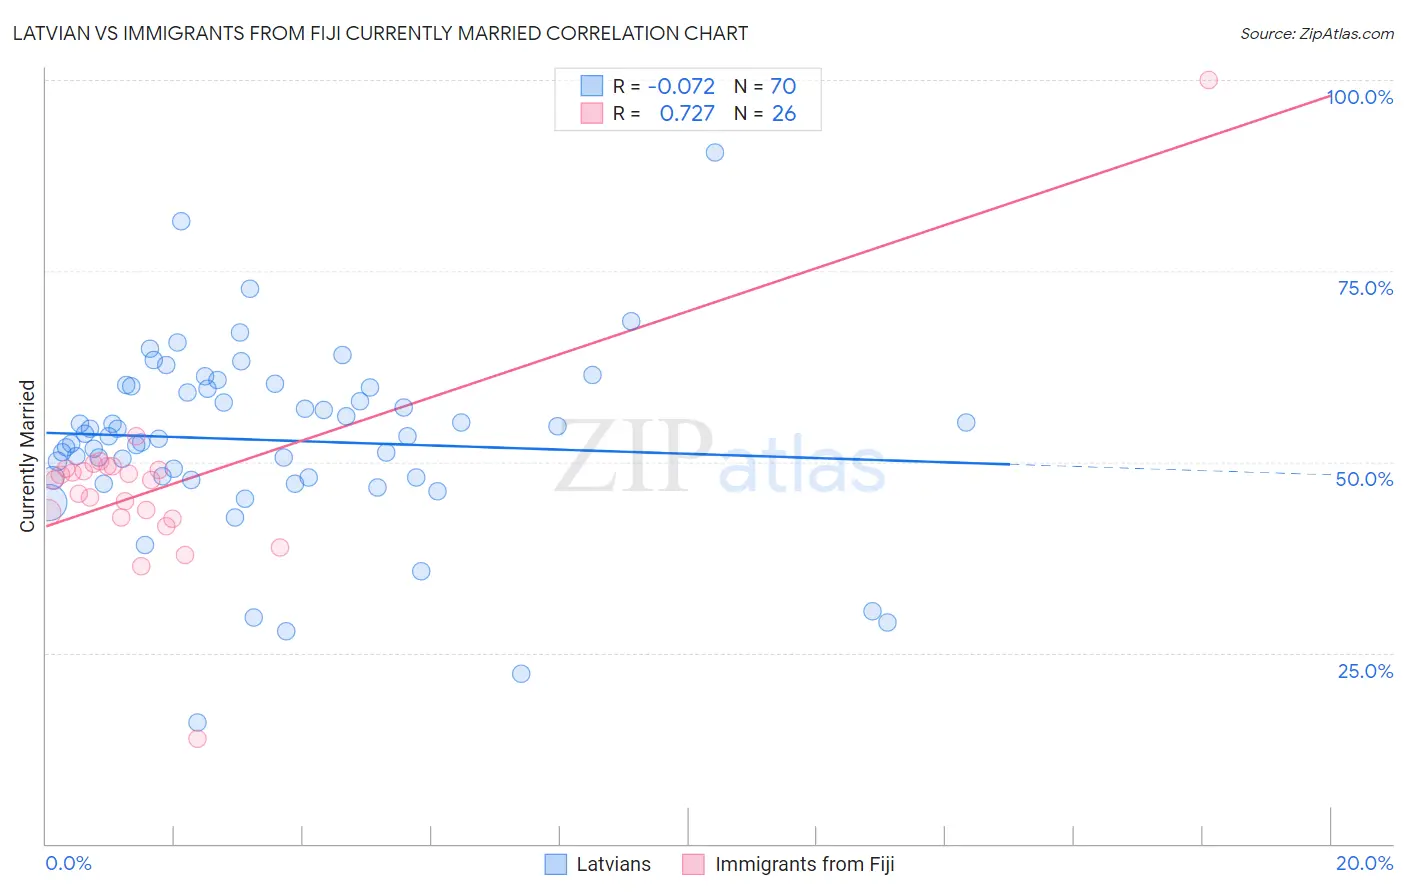
Latvian vs Immigrants from Fiji Currently Married Correlation Chart
The statistical analysis conducted on geographies consisting of 220,695,418 people shows a slight negative correlation between the proportion of Latvians and percentage of population currently married in the United States with a correlation coefficient (R) of -0.072 and weighted average of 48.5%. Similarly, the statistical analysis conducted on geographies consisting of 93,756,204 people shows a strong positive correlation between the proportion of Immigrants from Fiji and percentage of population currently married in the United States with a correlation coefficient (R) of 0.727 and weighted average of 46.2%, a difference of 5.0%.
Currently Married Correlation Summary
| Measurement | Latvian | Immigrants from Fiji |
| Minimum | 15.8% | 13.7% |
| Maximum | 90.5% | 100.0% |
| Range | 74.7% | 86.3% |
| Mean | 52.8% | 46.8% |
| Median | 53.4% | 47.6% |
| Interquartile 25% (IQ1) | 47.9% | 42.7% |
| Interquartile 75% (IQ3) | 59.7% | 49.1% |
| Interquartile Range (IQR) | 11.8% | 6.4% |
| Standard Deviation (Sample) | 12.1% | 13.2% |
| Standard Deviation (Population) | 12.0% | 13.0% |
Similar Demographics by Currently Married
Demographics Similar to Latvians by Currently Married
In terms of currently married, the demographic groups most similar to Latvians are Immigrants from Moldova (48.5%, a difference of 0.0%), Immigrants from North Macedonia (48.5%, a difference of 0.0%), Immigrants from Netherlands (48.5%, a difference of 0.030%), Immigrants from Austria (48.5%, a difference of 0.070%), and French (48.4%, a difference of 0.070%).
| Demographics | Rating | Rank | Currently Married |
| Bhutanese | 99.1 /100 | #49 | Exceptional 48.6% |
| Iranians | 99.0 /100 | #50 | Exceptional 48.6% |
| Whites/Caucasians | 99.0 /100 | #51 | Exceptional 48.6% |
| Russians | 98.9 /100 | #52 | Exceptional 48.6% |
| Immigrants | Austria | 98.8 /100 | #53 | Exceptional 48.5% |
| Immigrants | Moldova | 98.7 /100 | #54 | Exceptional 48.5% |
| Immigrants | North Macedonia | 98.7 /100 | #55 | Exceptional 48.5% |
| Latvians | 98.7 /100 | #56 | Exceptional 48.5% |
| Immigrants | Netherlands | 98.6 /100 | #57 | Exceptional 48.5% |
| French | 98.6 /100 | #58 | Exceptional 48.4% |
| Immigrants | Ireland | 98.5 /100 | #59 | Exceptional 48.4% |
| Immigrants | Romania | 98.5 /100 | #60 | Exceptional 48.4% |
| Romanians | 98.5 /100 | #61 | Exceptional 48.4% |
| Asians | 98.5 /100 | #62 | Exceptional 48.4% |
| Slavs | 98.3 /100 | #63 | Exceptional 48.4% |
Demographics Similar to Immigrants from Fiji by Currently Married
In terms of currently married, the demographic groups most similar to Immigrants from Fiji are Soviet Union (46.2%, a difference of 0.040%), South American (46.1%, a difference of 0.060%), Immigrants from Nepal (46.1%, a difference of 0.070%), Immigrants from France (46.2%, a difference of 0.13%), and Immigrants from Bosnia and Herzegovina (46.1%, a difference of 0.14%).
| Demographics | Rating | Rank | Currently Married |
| Immigrants | Chile | 36.8 /100 | #186 | Fair 46.4% |
| Immigrants | Peru | 35.3 /100 | #187 | Fair 46.4% |
| Colombians | 31.8 /100 | #188 | Fair 46.3% |
| Fijians | 30.3 /100 | #189 | Fair 46.3% |
| Choctaw | 29.1 /100 | #190 | Fair 46.3% |
| Immigrants | France | 27.7 /100 | #191 | Fair 46.2% |
| Soviet Union | 25.7 /100 | #192 | Fair 46.2% |
| Immigrants | Fiji | 25.0 /100 | #193 | Fair 46.2% |
| South Americans | 23.8 /100 | #194 | Fair 46.1% |
| Immigrants | Nepal | 23.7 /100 | #195 | Fair 46.1% |
| Immigrants | Bosnia and Herzegovina | 22.2 /100 | #196 | Fair 46.1% |
| Immigrants | Kuwait | 21.7 /100 | #197 | Fair 46.1% |
| Immigrants | Colombia | 21.0 /100 | #198 | Fair 46.1% |
| Immigrants | Costa Rica | 19.6 /100 | #199 | Poor 46.0% |
| Creek | 17.2 /100 | #200 | Poor 46.0% |