Immigrants from Denmark vs Icelander Currently Married
COMPARE
Immigrants from Denmark
Icelander
Currently Married
Currently Married Comparison
Immigrants from Denmark
Icelanders
47.6%
CURRENTLY MARRIED
90.9/ 100
METRIC RATING
113th/ 347
METRIC RANK
47.3%
CURRENTLY MARRIED
82.4/ 100
METRIC RATING
131st/ 347
METRIC RANK
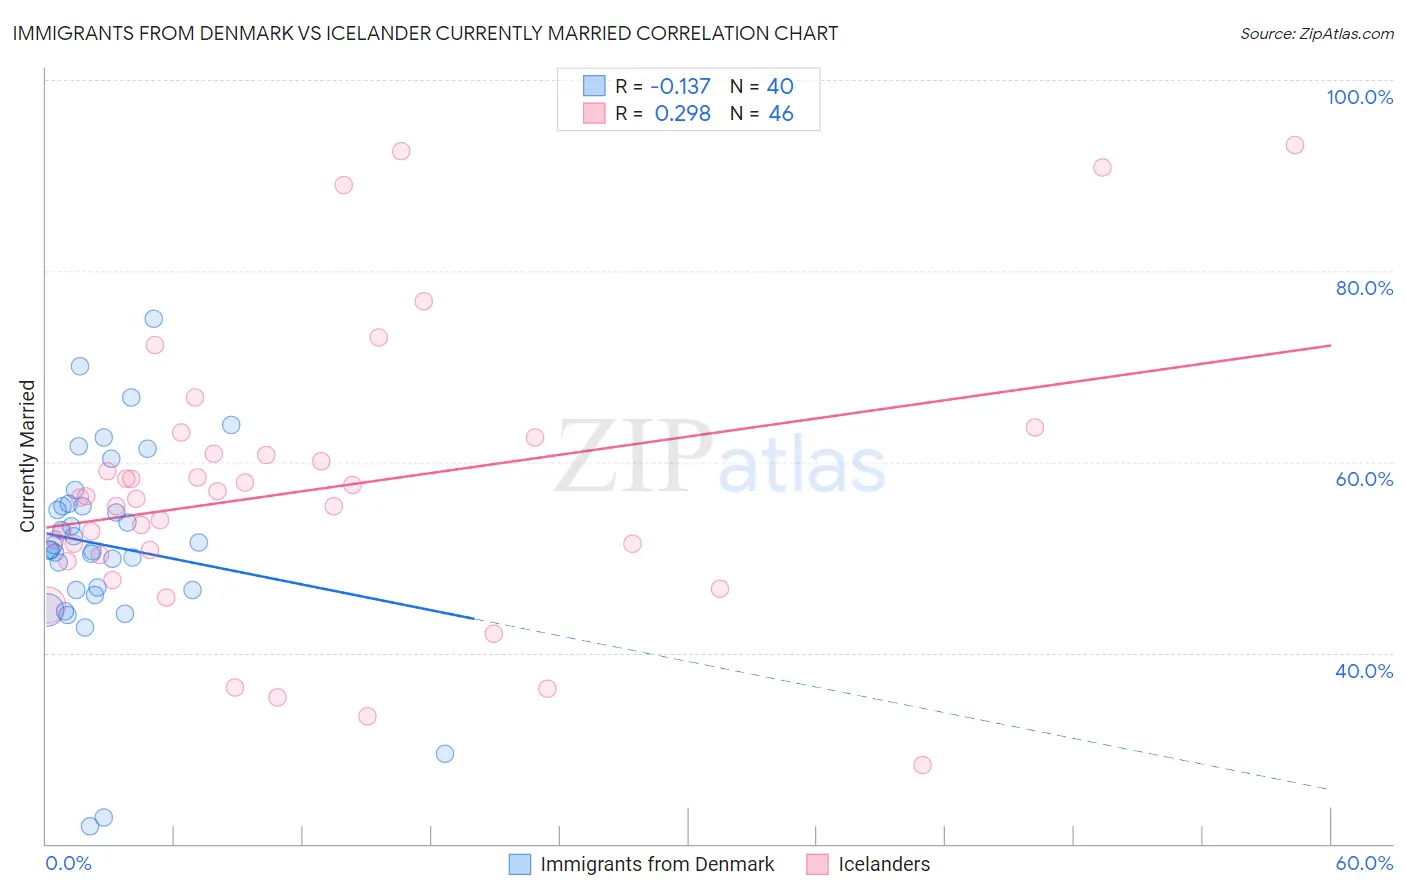
Immigrants from Denmark vs Icelander Currently Married Correlation Chart
The statistical analysis conducted on geographies consisting of 136,433,385 people shows a poor negative correlation between the proportion of Immigrants from Denmark and percentage of population currently married in the United States with a correlation coefficient (R) of -0.137 and weighted average of 47.6%. Similarly, the statistical analysis conducted on geographies consisting of 159,647,895 people shows a weak positive correlation between the proportion of Icelanders and percentage of population currently married in the United States with a correlation coefficient (R) of 0.298 and weighted average of 47.3%, a difference of 0.68%.
Currently Married Correlation Summary
| Measurement | Immigrants from Denmark | Icelander |
| Minimum | 21.8% | 28.3% |
| Maximum | 75.0% | 93.2% |
| Range | 53.2% | 64.9% |
| Mean | 51.3% | 57.1% |
| Median | 51.1% | 56.2% |
| Interquartile 25% (IQ1) | 46.6% | 50.3% |
| Interquartile 75% (IQ3) | 55.5% | 60.9% |
| Interquartile Range (IQR) | 8.9% | 10.6% |
| Standard Deviation (Sample) | 10.6% | 14.6% |
| Standard Deviation (Population) | 10.5% | 14.4% |
Demographics Similar to Immigrants from Denmark and Icelanders by Currently Married
In terms of currently married, the demographic groups most similar to Immigrants from Denmark are Immigrants from Western Europe (47.6%, a difference of 0.030%), South African (47.6%, a difference of 0.030%), Immigrants from Indonesia (47.6%, a difference of 0.040%), Palestinian (47.6%, a difference of 0.050%), and Puget Sound Salish (47.6%, a difference of 0.060%). Similarly, the demographic groups most similar to Icelanders are Immigrants from Iraq (47.3%, a difference of 0.020%), Afghan (47.3%, a difference of 0.040%), Sri Lankan (47.3%, a difference of 0.050%), Portuguese (47.3%, a difference of 0.12%), and Immigrants from Jordan (47.4%, a difference of 0.16%).
| Demographics | Rating | Rank | Currently Married |
| Immigrants | Western Europe | 91.1 /100 | #112 | Exceptional 47.6% |
| Immigrants | Denmark | 90.9 /100 | #113 | Exceptional 47.6% |
| South Africans | 90.5 /100 | #114 | Exceptional 47.6% |
| Immigrants | Indonesia | 90.5 /100 | #115 | Exceptional 47.6% |
| Palestinians | 90.4 /100 | #116 | Exceptional 47.6% |
| Puget Sound Salish | 90.3 /100 | #117 | Exceptional 47.6% |
| Immigrants | Philippines | 90.2 /100 | #118 | Exceptional 47.6% |
| Australians | 90.2 /100 | #119 | Exceptional 47.6% |
| Syrians | 88.9 /100 | #120 | Excellent 47.5% |
| Immigrants | Croatia | 88.6 /100 | #121 | Excellent 47.5% |
| Osage | 87.9 /100 | #122 | Excellent 47.5% |
| Immigrants | Kazakhstan | 87.2 /100 | #123 | Excellent 47.4% |
| Laotians | 86.6 /100 | #124 | Excellent 47.4% |
| Okinawans | 85.3 /100 | #125 | Excellent 47.4% |
| Immigrants | Jordan | 84.9 /100 | #126 | Excellent 47.4% |
| New Zealanders | 84.9 /100 | #127 | Excellent 47.4% |
| Portuguese | 84.2 /100 | #128 | Excellent 47.3% |
| Sri Lankans | 83.2 /100 | #129 | Excellent 47.3% |
| Immigrants | Iraq | 82.8 /100 | #130 | Excellent 47.3% |
| Icelanders | 82.4 /100 | #131 | Excellent 47.3% |
| Afghans | 81.8 /100 | #132 | Excellent 47.3% |