Immigrants from Venezuela vs Icelander Currently Married
COMPARE
Immigrants from Venezuela
Icelander
Currently Married
Currently Married Comparison
Immigrants from Venezuela
Icelanders
47.0%
CURRENTLY MARRIED
68.6/ 100
METRIC RATING
153rd/ 347
METRIC RANK
47.3%
CURRENTLY MARRIED
82.4/ 100
METRIC RATING
131st/ 347
METRIC RANK
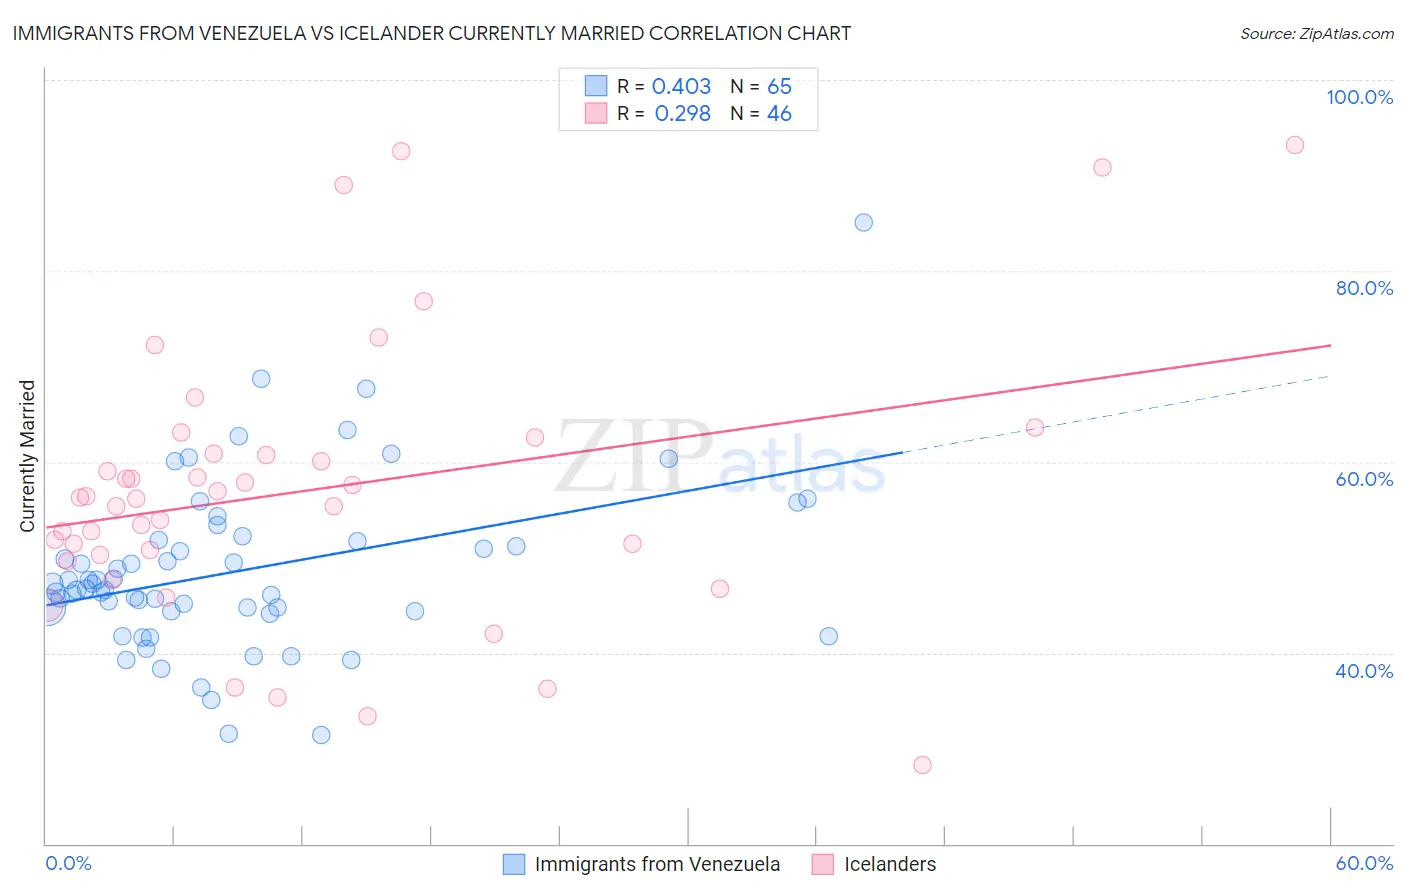
Immigrants from Venezuela vs Icelander Currently Married Correlation Chart
The statistical analysis conducted on geographies consisting of 287,838,026 people shows a moderate positive correlation between the proportion of Immigrants from Venezuela and percentage of population currently married in the United States with a correlation coefficient (R) of 0.403 and weighted average of 47.0%. Similarly, the statistical analysis conducted on geographies consisting of 159,647,895 people shows a weak positive correlation between the proportion of Icelanders and percentage of population currently married in the United States with a correlation coefficient (R) of 0.298 and weighted average of 47.3%, a difference of 0.69%.
Currently Married Correlation Summary
| Measurement | Immigrants from Venezuela | Icelander |
| Minimum | 31.4% | 28.3% |
| Maximum | 85.1% | 93.2% |
| Range | 53.7% | 64.9% |
| Mean | 48.6% | 57.1% |
| Median | 46.7% | 56.2% |
| Interquartile 25% (IQ1) | 44.3% | 50.3% |
| Interquartile 75% (IQ3) | 51.7% | 60.9% |
| Interquartile Range (IQR) | 7.4% | 10.6% |
| Standard Deviation (Sample) | 9.0% | 14.6% |
| Standard Deviation (Population) | 8.9% | 14.4% |
Similar Demographics by Currently Married
Demographics Similar to Immigrants from Venezuela by Currently Married
In terms of currently married, the demographic groups most similar to Immigrants from Venezuela are Albanian (47.0%, a difference of 0.0%), Arab (47.0%, a difference of 0.0%), Immigrants from Serbia (47.0%, a difference of 0.010%), Spanish (47.0%, a difference of 0.020%), and Immigrants from Switzerland (46.9%, a difference of 0.030%).
| Demographics | Rating | Rank | Currently Married |
| Carpatho Rusyns | 72.6 /100 | #146 | Good 47.0% |
| Immigrants | Argentina | 72.0 /100 | #147 | Good 47.0% |
| Cambodians | 70.4 /100 | #148 | Good 47.0% |
| Zimbabweans | 70.1 /100 | #149 | Good 47.0% |
| Immigrants | Turkey | 70.0 /100 | #150 | Good 47.0% |
| Chileans | 69.8 /100 | #151 | Good 47.0% |
| Immigrants | Serbia | 68.8 /100 | #152 | Good 47.0% |
| Immigrants | Venezuela | 68.6 /100 | #153 | Good 47.0% |
| Albanians | 68.6 /100 | #154 | Good 47.0% |
| Arabs | 68.6 /100 | #155 | Good 47.0% |
| Spanish | 68.1 /100 | #156 | Good 47.0% |
| Immigrants | Switzerland | 67.8 /100 | #157 | Good 46.9% |
| Cherokee | 66.8 /100 | #158 | Good 46.9% |
| Iraqis | 66.4 /100 | #159 | Good 46.9% |
| Immigrants | Uzbekistan | 66.0 /100 | #160 | Good 46.9% |
Demographics Similar to Icelanders by Currently Married
In terms of currently married, the demographic groups most similar to Icelanders are Immigrants from Iraq (47.3%, a difference of 0.020%), Afghan (47.3%, a difference of 0.040%), Sri Lankan (47.3%, a difference of 0.050%), Immigrants from Malaysia (47.3%, a difference of 0.080%), and Immigrants from Australia (47.3%, a difference of 0.080%).
| Demographics | Rating | Rank | Currently Married |
| Laotians | 86.6 /100 | #124 | Excellent 47.4% |
| Okinawans | 85.3 /100 | #125 | Excellent 47.4% |
| Immigrants | Jordan | 84.9 /100 | #126 | Excellent 47.4% |
| New Zealanders | 84.9 /100 | #127 | Excellent 47.4% |
| Portuguese | 84.2 /100 | #128 | Excellent 47.3% |
| Sri Lankans | 83.2 /100 | #129 | Excellent 47.3% |
| Immigrants | Iraq | 82.8 /100 | #130 | Excellent 47.3% |
| Icelanders | 82.4 /100 | #131 | Excellent 47.3% |
| Afghans | 81.8 /100 | #132 | Excellent 47.3% |
| Immigrants | Malaysia | 81.1 /100 | #133 | Excellent 47.3% |
| Immigrants | Australia | 81.1 /100 | #134 | Excellent 47.3% |
| Immigrants | Norway | 79.7 /100 | #135 | Good 47.2% |
| Immigrants | Vietnam | 78.2 /100 | #136 | Good 47.2% |
| Paraguayans | 77.8 /100 | #137 | Good 47.2% |
| Pakistanis | 77.5 /100 | #138 | Good 47.2% |