Latvian vs Immigrants from Peru Average Family Size
COMPARE
Latvian
Immigrants from Peru
Average Family Size
Average Family Size Comparison
Latvians
Immigrants from Peru
3.11
AVERAGE FAMILY SIZE
0.0/ 100
METRIC RATING
330th/ 347
METRIC RANK
3.31
AVERAGE FAMILY SIZE
99.7/ 100
METRIC RATING
87th/ 347
METRIC RANK
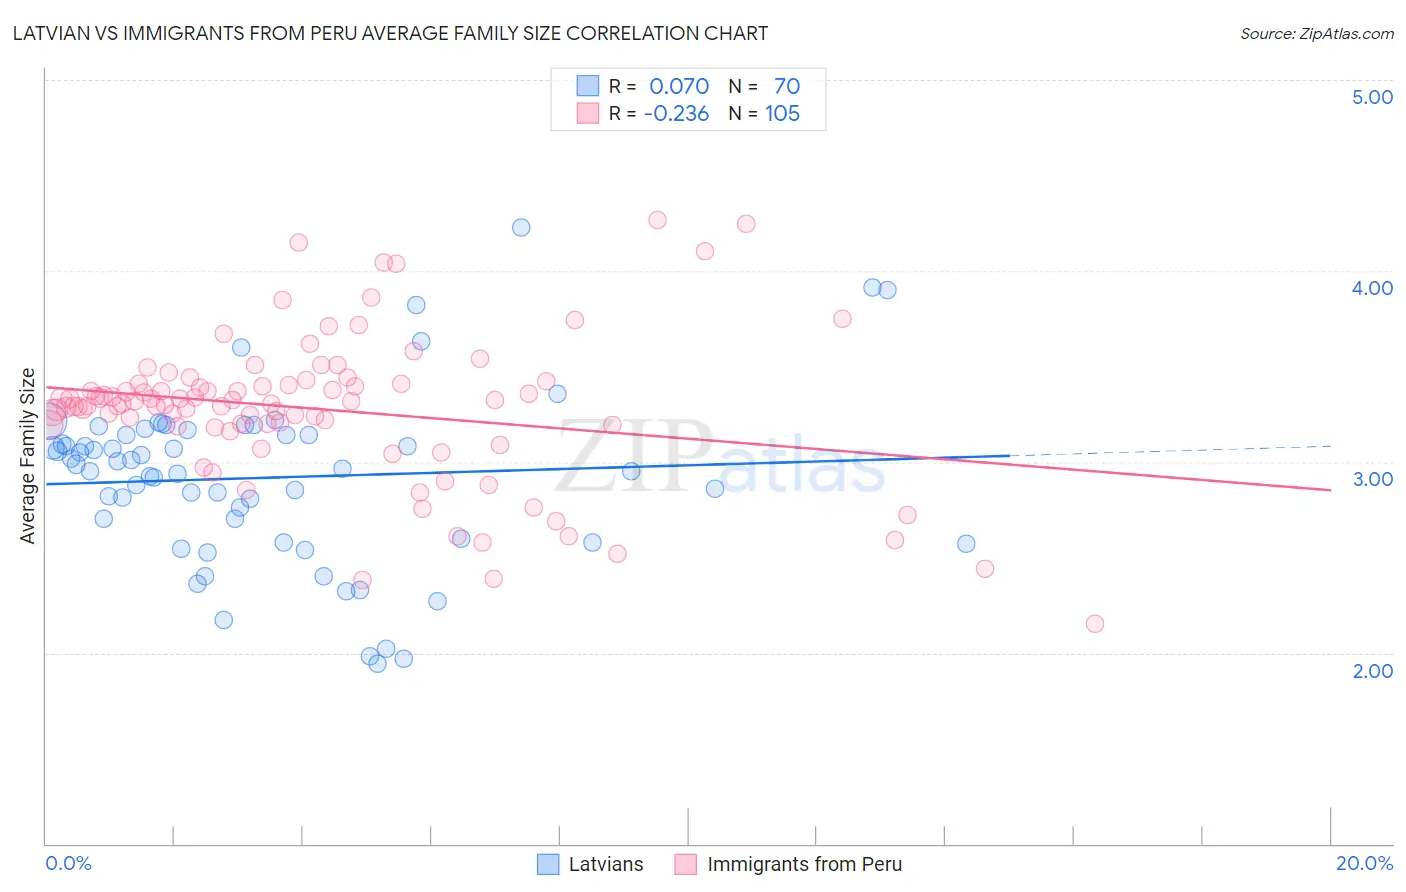
Latvian vs Immigrants from Peru Average Family Size Correlation Chart
The statistical analysis conducted on geographies consisting of 220,660,131 people shows a slight positive correlation between the proportion of Latvians and average family size in the United States with a correlation coefficient (R) of 0.070 and weighted average of 3.11. Similarly, the statistical analysis conducted on geographies consisting of 328,761,601 people shows a weak negative correlation between the proportion of Immigrants from Peru and average family size in the United States with a correlation coefficient (R) of -0.236 and weighted average of 3.31, a difference of 6.6%.
Average Family Size Correlation Summary
| Measurement | Latvian | Immigrants from Peru |
| Minimum | 1.94 | 2.15 |
| Maximum | 4.23 | 4.27 |
| Range | 2.29 | 2.12 |
| Mean | 2.92 | 3.28 |
| Median | 2.97 | 3.31 |
| Interquartile 25% (IQ1) | 2.60 | 3.19 |
| Interquartile 75% (IQ3) | 3.14 | 3.41 |
| Interquartile Range (IQR) | 0.54 | 0.22 |
| Standard Deviation (Sample) | 0.45 | 0.38 |
| Standard Deviation (Population) | 0.45 | 0.38 |
Similar Demographics by Average Family Size
Demographics Similar to Latvians by Average Family Size
In terms of average family size, the demographic groups most similar to Latvians are Scotch-Irish (3.11, a difference of 0.0%), Scottish (3.11, a difference of 0.010%), Estonian (3.10, a difference of 0.050%), Belgian (3.11, a difference of 0.060%), and Lithuanian (3.10, a difference of 0.060%).
| Demographics | Rating | Rank | Average Family Size |
| Soviet Union | 0.0 /100 | #323 | Tragic 3.11 |
| Celtics | 0.0 /100 | #324 | Tragic 3.11 |
| English | 0.0 /100 | #325 | Tragic 3.11 |
| Ottawa | 0.0 /100 | #326 | Tragic 3.11 |
| Dutch | 0.0 /100 | #327 | Tragic 3.11 |
| Czechs | 0.0 /100 | #328 | Tragic 3.11 |
| Belgians | 0.0 /100 | #329 | Tragic 3.11 |
| Latvians | 0.0 /100 | #330 | Tragic 3.11 |
| Scotch-Irish | 0.0 /100 | #331 | Tragic 3.11 |
| Scottish | 0.0 /100 | #332 | Tragic 3.11 |
| Estonians | 0.0 /100 | #333 | Tragic 3.10 |
| Lithuanians | 0.0 /100 | #334 | Tragic 3.10 |
| Luxembourgers | 0.0 /100 | #335 | Tragic 3.10 |
| Irish | 0.0 /100 | #336 | Tragic 3.10 |
| Swedes | 0.0 /100 | #337 | Tragic 3.10 |
Demographics Similar to Immigrants from Peru by Average Family Size
In terms of average family size, the demographic groups most similar to Immigrants from Peru are Jamaican (3.31, a difference of 0.050%), Afghan (3.31, a difference of 0.070%), Immigrants from Bolivia (3.31, a difference of 0.090%), Malaysian (3.31, a difference of 0.10%), and Immigrants from Nigeria (3.32, a difference of 0.12%).
| Demographics | Rating | Rank | Average Family Size |
| Lumbee | 99.8 /100 | #80 | Exceptional 3.32 |
| Immigrants | Dominica | 99.8 /100 | #81 | Exceptional 3.32 |
| Ecuadorians | 99.8 /100 | #82 | Exceptional 3.32 |
| Immigrants | Afghanistan | 99.8 /100 | #83 | Exceptional 3.32 |
| Immigrants | Nigeria | 99.7 /100 | #84 | Exceptional 3.32 |
| Afghans | 99.7 /100 | #85 | Exceptional 3.31 |
| Jamaicans | 99.7 /100 | #86 | Exceptional 3.31 |
| Immigrants | Peru | 99.7 /100 | #87 | Exceptional 3.31 |
| Immigrants | Bolivia | 99.6 /100 | #88 | Exceptional 3.31 |
| Malaysians | 99.6 /100 | #89 | Exceptional 3.31 |
| Menominee | 99.4 /100 | #90 | Exceptional 3.30 |
| Immigrants | Pakistan | 99.2 /100 | #91 | Exceptional 3.30 |
| Immigrants | Cameroon | 99.2 /100 | #92 | Exceptional 3.30 |
| Peruvians | 99.2 /100 | #93 | Exceptional 3.30 |
| Sierra Leoneans | 99.0 /100 | #94 | Exceptional 3.30 |