Immigrants from Norway vs Hmong Currently Married
COMPARE
Immigrants from Norway
Hmong
Currently Married
Currently Married Comparison
Immigrants from Norway
Hmong
47.2%
CURRENTLY MARRIED
79.7/ 100
METRIC RATING
135th/ 347
METRIC RANK
47.1%
CURRENTLY MARRIED
73.4/ 100
METRIC RATING
144th/ 347
METRIC RANK
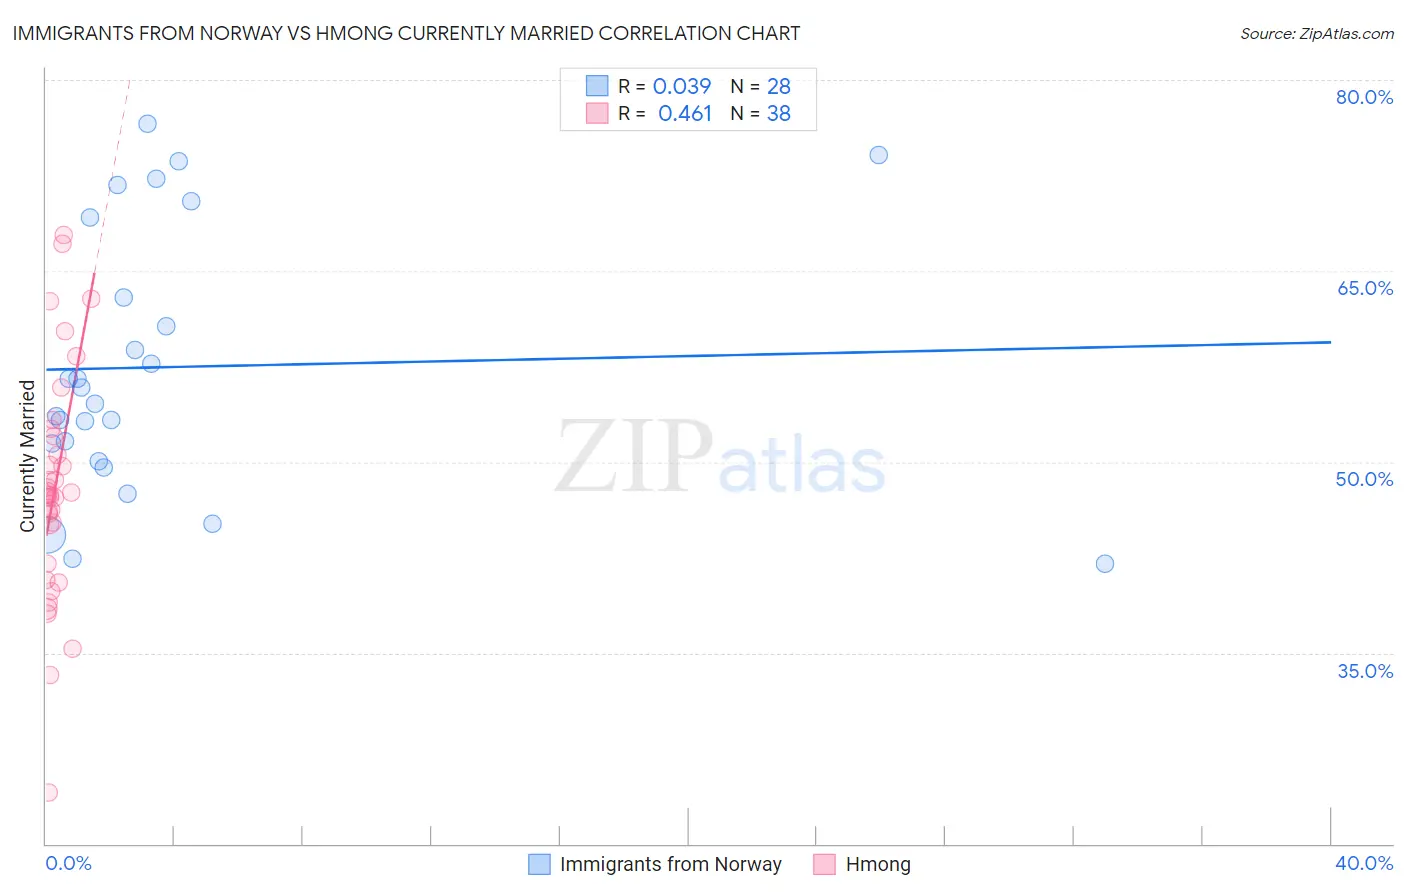
Immigrants from Norway vs Hmong Currently Married Correlation Chart
The statistical analysis conducted on geographies consisting of 116,715,182 people shows no correlation between the proportion of Immigrants from Norway and percentage of population currently married in the United States with a correlation coefficient (R) of 0.039 and weighted average of 47.2%. Similarly, the statistical analysis conducted on geographies consisting of 24,669,739 people shows a moderate positive correlation between the proportion of Hmong and percentage of population currently married in the United States with a correlation coefficient (R) of 0.461 and weighted average of 47.1%, a difference of 0.32%.
Currently Married Correlation Summary
| Measurement | Immigrants from Norway | Hmong |
| Minimum | 42.0% | 24.0% |
| Maximum | 76.6% | 67.8% |
| Range | 34.6% | 43.8% |
| Mean | 57.5% | 47.9% |
| Median | 55.2% | 47.4% |
| Interquartile 25% (IQ1) | 50.8% | 42.0% |
| Interquartile 75% (IQ3) | 66.0% | 52.0% |
| Interquartile Range (IQR) | 15.3% | 10.0% |
| Standard Deviation (Sample) | 10.2% | 9.1% |
| Standard Deviation (Population) | 10.1% | 9.0% |
Demographics Similar to Immigrants from Norway and Hmong by Currently Married
In terms of currently married, the demographic groups most similar to Immigrants from Norway are Immigrants from Malaysia (47.3%, a difference of 0.080%), Immigrants from Australia (47.3%, a difference of 0.080%), Immigrants from Vietnam (47.2%, a difference of 0.080%), Paraguayan (47.2%, a difference of 0.10%), and Pakistani (47.2%, a difference of 0.12%). Similarly, the demographic groups most similar to Hmong are Immigrants from South Eastern Asia (47.1%, a difference of 0.030%), Argentinean (47.1%, a difference of 0.040%), Guamanian/Chamorro (47.1%, a difference of 0.040%), Carpatho Rusyn (47.0%, a difference of 0.040%), and Venezuelan (47.1%, a difference of 0.050%).
| Demographics | Rating | Rank | Currently Married |
| Sri Lankans | 83.2 /100 | #129 | Excellent 47.3% |
| Immigrants | Iraq | 82.8 /100 | #130 | Excellent 47.3% |
| Icelanders | 82.4 /100 | #131 | Excellent 47.3% |
| Afghans | 81.8 /100 | #132 | Excellent 47.3% |
| Immigrants | Malaysia | 81.1 /100 | #133 | Excellent 47.3% |
| Immigrants | Australia | 81.1 /100 | #134 | Excellent 47.3% |
| Immigrants | Norway | 79.7 /100 | #135 | Good 47.2% |
| Immigrants | Vietnam | 78.2 /100 | #136 | Good 47.2% |
| Paraguayans | 77.8 /100 | #137 | Good 47.2% |
| Pakistanis | 77.5 /100 | #138 | Good 47.2% |
| Yugoslavians | 77.4 /100 | #139 | Good 47.2% |
| Cajuns | 75.3 /100 | #140 | Good 47.1% |
| Venezuelans | 74.4 /100 | #141 | Good 47.1% |
| Argentineans | 74.4 /100 | #142 | Good 47.1% |
| Guamanians/Chamorros | 74.2 /100 | #143 | Good 47.1% |
| Hmong | 73.4 /100 | #144 | Good 47.1% |
| Immigrants | South Eastern Asia | 72.9 /100 | #145 | Good 47.1% |
| Carpatho Rusyns | 72.6 /100 | #146 | Good 47.0% |
| Immigrants | Argentina | 72.0 /100 | #147 | Good 47.0% |
| Cambodians | 70.4 /100 | #148 | Good 47.0% |
| Zimbabweans | 70.1 /100 | #149 | Good 47.0% |