Immigrants from Peru vs Hmong Currently Married
COMPARE
Immigrants from Peru
Hmong
Currently Married
Currently Married Comparison
Immigrants from Peru
Hmong
46.4%
CURRENTLY MARRIED
35.3/ 100
METRIC RATING
187th/ 347
METRIC RANK
47.1%
CURRENTLY MARRIED
73.4/ 100
METRIC RATING
144th/ 347
METRIC RANK
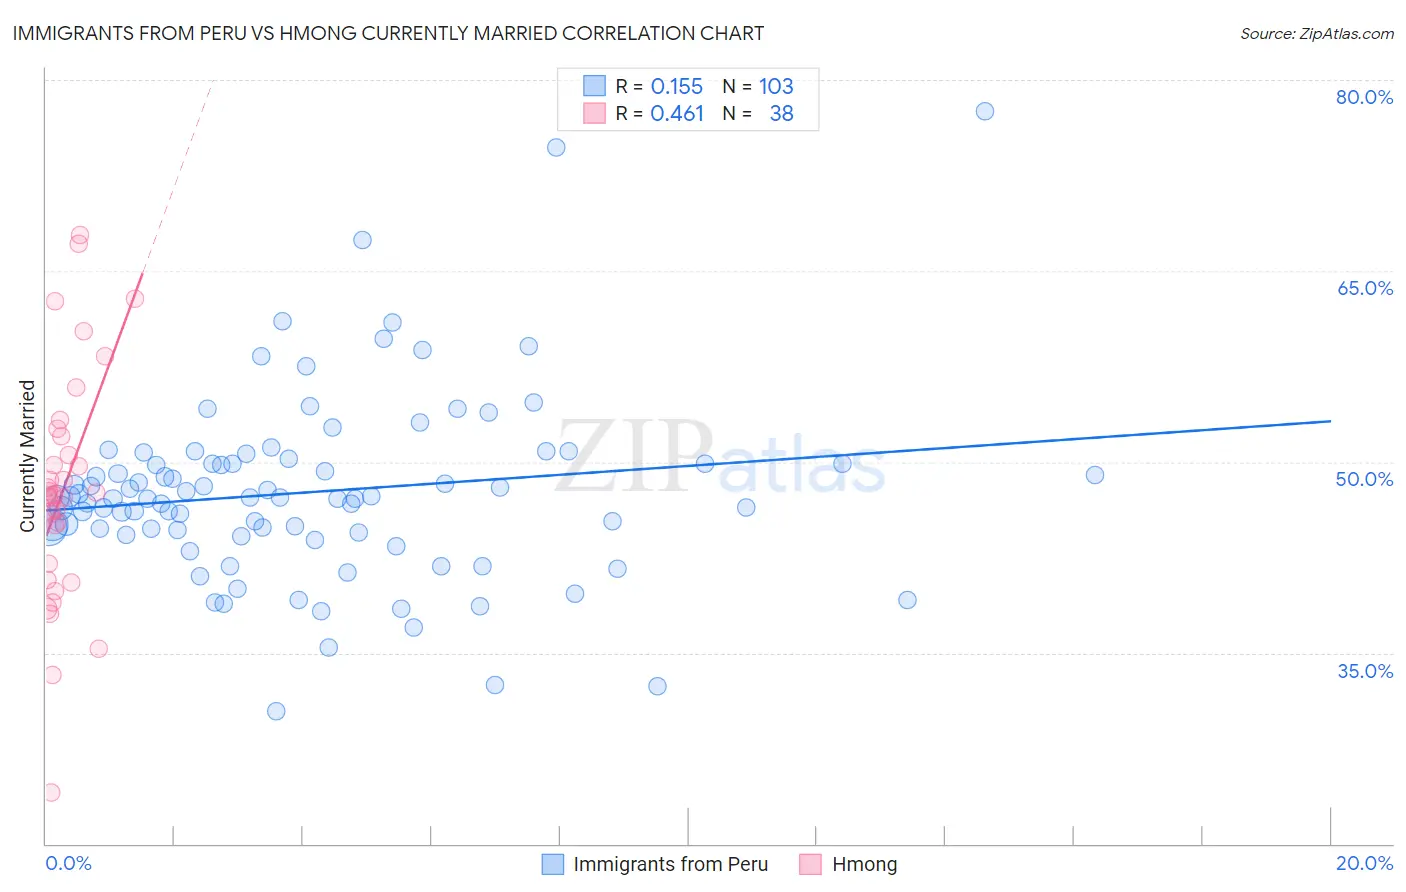
Immigrants from Peru vs Hmong Currently Married Correlation Chart
The statistical analysis conducted on geographies consisting of 328,847,084 people shows a poor positive correlation between the proportion of Immigrants from Peru and percentage of population currently married in the United States with a correlation coefficient (R) of 0.155 and weighted average of 46.4%. Similarly, the statistical analysis conducted on geographies consisting of 24,669,739 people shows a moderate positive correlation between the proportion of Hmong and percentage of population currently married in the United States with a correlation coefficient (R) of 0.461 and weighted average of 47.1%, a difference of 1.5%.
Currently Married Correlation Summary
| Measurement | Immigrants from Peru | Hmong |
| Minimum | 30.4% | 24.0% |
| Maximum | 77.5% | 67.8% |
| Range | 47.1% | 43.8% |
| Mean | 47.6% | 47.9% |
| Median | 47.2% | 47.4% |
| Interquartile 25% (IQ1) | 44.5% | 42.0% |
| Interquartile 75% (IQ3) | 49.9% | 52.0% |
| Interquartile Range (IQR) | 5.4% | 10.0% |
| Standard Deviation (Sample) | 7.3% | 9.1% |
| Standard Deviation (Population) | 7.3% | 9.0% |
Similar Demographics by Currently Married
Demographics Similar to Immigrants from Peru by Currently Married
In terms of currently married, the demographic groups most similar to Immigrants from Peru are Immigrants from Chile (46.4%, a difference of 0.060%), Mongolian (46.4%, a difference of 0.090%), Colombian (46.3%, a difference of 0.14%), Brazilian (46.4%, a difference of 0.16%), and Immigrants from Northern Africa (46.5%, a difference of 0.17%).
| Demographics | Rating | Rank | Currently Married |
| Costa Ricans | 43.7 /100 | #180 | Average 46.5% |
| Ottawa | 43.0 /100 | #181 | Average 46.5% |
| Potawatomi | 41.9 /100 | #182 | Average 46.5% |
| Immigrants | Northern Africa | 39.7 /100 | #183 | Fair 46.5% |
| Brazilians | 39.3 /100 | #184 | Fair 46.4% |
| Mongolians | 37.6 /100 | #185 | Fair 46.4% |
| Immigrants | Chile | 36.8 /100 | #186 | Fair 46.4% |
| Immigrants | Peru | 35.3 /100 | #187 | Fair 46.4% |
| Colombians | 31.8 /100 | #188 | Fair 46.3% |
| Fijians | 30.3 /100 | #189 | Fair 46.3% |
| Choctaw | 29.1 /100 | #190 | Fair 46.3% |
| Immigrants | France | 27.7 /100 | #191 | Fair 46.2% |
| Soviet Union | 25.7 /100 | #192 | Fair 46.2% |
| Immigrants | Fiji | 25.0 /100 | #193 | Fair 46.2% |
| South Americans | 23.8 /100 | #194 | Fair 46.1% |
Demographics Similar to Hmong by Currently Married
In terms of currently married, the demographic groups most similar to Hmong are Immigrants from South Eastern Asia (47.1%, a difference of 0.030%), Argentinean (47.1%, a difference of 0.040%), Guamanian/Chamorro (47.1%, a difference of 0.040%), Carpatho Rusyn (47.0%, a difference of 0.040%), and Venezuelan (47.1%, a difference of 0.050%).
| Demographics | Rating | Rank | Currently Married |
| Paraguayans | 77.8 /100 | #137 | Good 47.2% |
| Pakistanis | 77.5 /100 | #138 | Good 47.2% |
| Yugoslavians | 77.4 /100 | #139 | Good 47.2% |
| Cajuns | 75.3 /100 | #140 | Good 47.1% |
| Venezuelans | 74.4 /100 | #141 | Good 47.1% |
| Argentineans | 74.4 /100 | #142 | Good 47.1% |
| Guamanians/Chamorros | 74.2 /100 | #143 | Good 47.1% |
| Hmong | 73.4 /100 | #144 | Good 47.1% |
| Immigrants | South Eastern Asia | 72.9 /100 | #145 | Good 47.1% |
| Carpatho Rusyns | 72.6 /100 | #146 | Good 47.0% |
| Immigrants | Argentina | 72.0 /100 | #147 | Good 47.0% |
| Cambodians | 70.4 /100 | #148 | Good 47.0% |
| Zimbabweans | 70.1 /100 | #149 | Good 47.0% |
| Immigrants | Turkey | 70.0 /100 | #150 | Good 47.0% |
| Chileans | 69.8 /100 | #151 | Good 47.0% |