Immigrants from Poland vs Nicaraguan Divorced or Separated
COMPARE
Immigrants from Poland
Nicaraguan
Divorced or Separated
Divorced or Separated Comparison
Immigrants from Poland
Nicaraguans
11.2%
DIVORCED OR SEPARATED
100.0/ 100
METRIC RATING
47th/ 347
METRIC RANK
13.0%
DIVORCED OR SEPARATED
0.0/ 100
METRIC RATING
296th/ 347
METRIC RANK
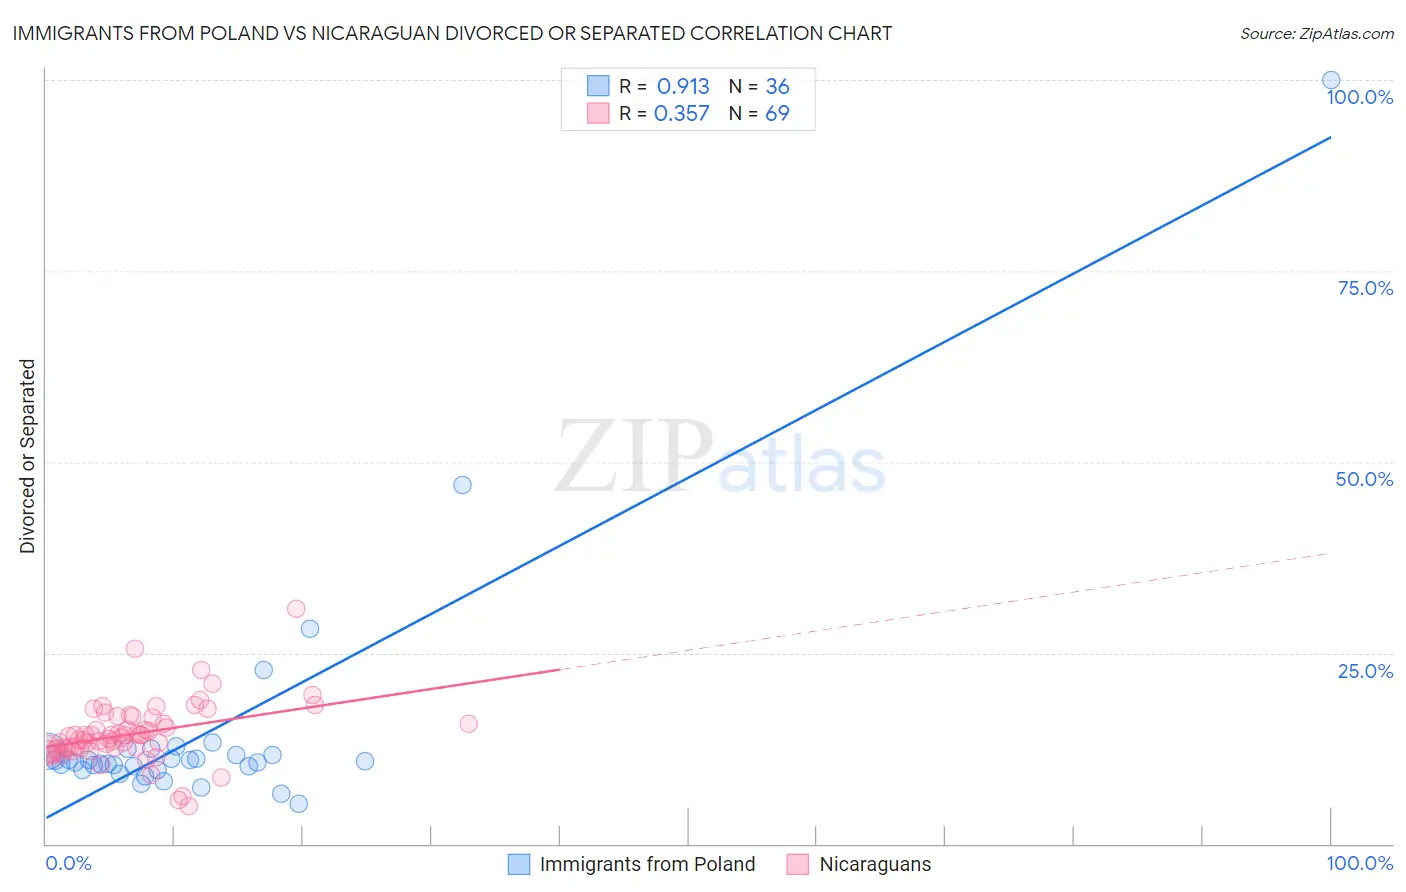
Immigrants from Poland vs Nicaraguan Divorced or Separated Correlation Chart
The statistical analysis conducted on geographies consisting of 304,831,025 people shows a near-perfect positive correlation between the proportion of Immigrants from Poland and percentage of population currently divorced or separated in the United States with a correlation coefficient (R) of 0.913 and weighted average of 11.2%. Similarly, the statistical analysis conducted on geographies consisting of 285,619,743 people shows a mild positive correlation between the proportion of Nicaraguans and percentage of population currently divorced or separated in the United States with a correlation coefficient (R) of 0.357 and weighted average of 13.0%, a difference of 16.0%.
Divorced or Separated Correlation Summary
| Measurement | Immigrants from Poland | Nicaraguan |
| Minimum | 5.2% | 4.9% |
| Maximum | 100.0% | 30.8% |
| Range | 94.8% | 25.9% |
| Mean | 14.6% | 14.3% |
| Median | 10.7% | 13.9% |
| Interquartile 25% (IQ1) | 9.9% | 12.4% |
| Interquartile 75% (IQ3) | 11.9% | 16.1% |
| Interquartile Range (IQR) | 2.0% | 3.8% |
| Standard Deviation (Sample) | 16.3% | 4.0% |
| Standard Deviation (Population) | 16.1% | 4.0% |
Similar Demographics by Divorced or Separated
Demographics Similar to Immigrants from Poland by Divorced or Separated
In terms of divorced or separated, the demographic groups most similar to Immigrants from Poland are Laotian (11.2%, a difference of 0.010%), Immigrants from Turkey (11.2%, a difference of 0.030%), Immigrants from Saudi Arabia (11.2%, a difference of 0.040%), Bolivian (11.2%, a difference of 0.10%), and Turkish (11.2%, a difference of 0.12%).
| Demographics | Rating | Rank | Divorced or Separated |
| Soviet Union | 100.0 /100 | #40 | Exceptional 11.1% |
| Bhutanese | 100.0 /100 | #41 | Exceptional 11.2% |
| Chinese | 100.0 /100 | #42 | Exceptional 11.2% |
| Immigrants | Belarus | 100.0 /100 | #43 | Exceptional 11.2% |
| Immigrants | Western Asia | 100.0 /100 | #44 | Exceptional 11.2% |
| Turks | 100.0 /100 | #45 | Exceptional 11.2% |
| Laotians | 100.0 /100 | #46 | Exceptional 11.2% |
| Immigrants | Poland | 100.0 /100 | #47 | Exceptional 11.2% |
| Immigrants | Turkey | 100.0 /100 | #48 | Exceptional 11.2% |
| Immigrants | Saudi Arabia | 100.0 /100 | #49 | Exceptional 11.2% |
| Bolivians | 100.0 /100 | #50 | Exceptional 11.2% |
| Immigrants | Bolivia | 100.0 /100 | #51 | Exceptional 11.3% |
| Immigrants | Australia | 99.9 /100 | #52 | Exceptional 11.3% |
| Immigrants | Lithuania | 99.9 /100 | #53 | Exceptional 11.3% |
| Eastern Europeans | 99.9 /100 | #54 | Exceptional 11.3% |
Demographics Similar to Nicaraguans by Divorced or Separated
In terms of divorced or separated, the demographic groups most similar to Nicaraguans are Native/Alaskan (13.0%, a difference of 0.050%), Venezuelan (13.0%, a difference of 0.12%), Immigrants from Jamaica (13.0%, a difference of 0.16%), Celtic (13.0%, a difference of 0.41%), and Apache (12.9%, a difference of 0.54%).
| Demographics | Rating | Rank | Divorced or Separated |
| Iroquois | 0.0 /100 | #289 | Tragic 12.9% |
| Pima | 0.0 /100 | #290 | Tragic 12.9% |
| Immigrants | Honduras | 0.0 /100 | #291 | Tragic 12.9% |
| Scotch-Irish | 0.0 /100 | #292 | Tragic 12.9% |
| Jamaicans | 0.0 /100 | #293 | Tragic 12.9% |
| Apache | 0.0 /100 | #294 | Tragic 12.9% |
| Celtics | 0.0 /100 | #295 | Tragic 13.0% |
| Nicaraguans | 0.0 /100 | #296 | Tragic 13.0% |
| Natives/Alaskans | 0.0 /100 | #297 | Tragic 13.0% |
| Venezuelans | 0.0 /100 | #298 | Tragic 13.0% |
| Immigrants | Jamaica | 0.0 /100 | #299 | Tragic 13.0% |
| Immigrants | Cabo Verde | 0.0 /100 | #300 | Tragic 13.1% |
| Alaskan Athabascans | 0.0 /100 | #301 | Tragic 13.1% |
| Immigrants | Venezuela | 0.0 /100 | #302 | Tragic 13.1% |
| Cape Verdeans | 0.0 /100 | #303 | Tragic 13.1% |