Russian vs Nicaraguan Divorced or Separated
COMPARE
Russian
Nicaraguan
Divorced or Separated
Divorced or Separated Comparison
Russians
Nicaraguans
11.5%
DIVORCED OR SEPARATED
99.4/ 100
METRIC RATING
81st/ 347
METRIC RANK
13.0%
DIVORCED OR SEPARATED
0.0/ 100
METRIC RATING
296th/ 347
METRIC RANK
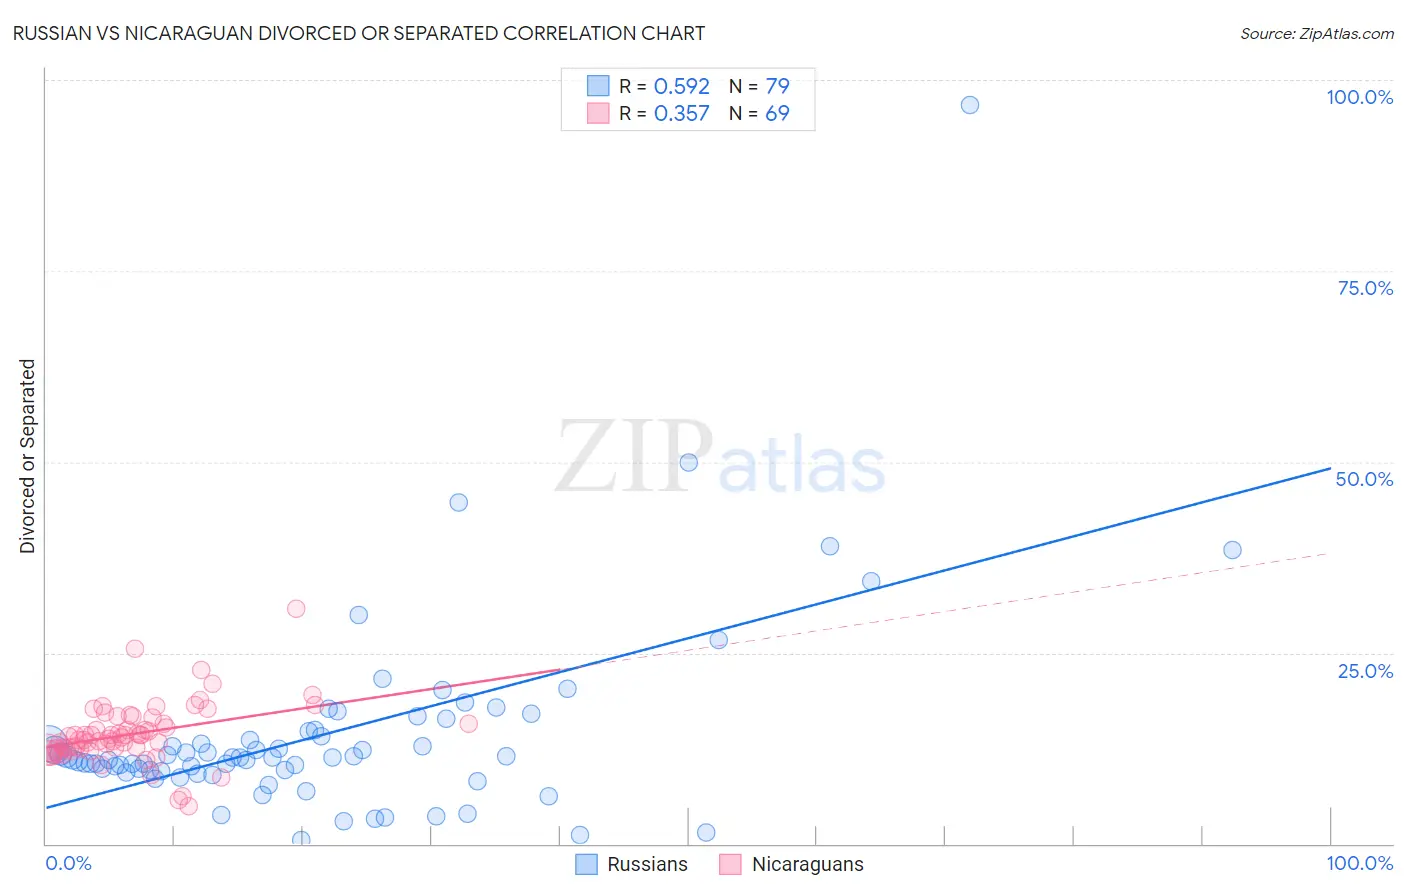
Russian vs Nicaraguan Divorced or Separated Correlation Chart
The statistical analysis conducted on geographies consisting of 511,901,777 people shows a substantial positive correlation between the proportion of Russians and percentage of population currently divorced or separated in the United States with a correlation coefficient (R) of 0.592 and weighted average of 11.5%. Similarly, the statistical analysis conducted on geographies consisting of 285,619,743 people shows a mild positive correlation between the proportion of Nicaraguans and percentage of population currently divorced or separated in the United States with a correlation coefficient (R) of 0.357 and weighted average of 13.0%, a difference of 12.9%.
Divorced or Separated Correlation Summary
| Measurement | Russian | Nicaraguan |
| Minimum | 0.50% | 4.9% |
| Maximum | 96.8% | 30.8% |
| Range | 96.3% | 25.9% |
| Mean | 14.3% | 14.3% |
| Median | 11.3% | 13.9% |
| Interquartile 25% (IQ1) | 9.6% | 12.4% |
| Interquartile 75% (IQ3) | 14.8% | 16.1% |
| Interquartile Range (IQR) | 5.2% | 3.8% |
| Standard Deviation (Sample) | 13.0% | 4.0% |
| Standard Deviation (Population) | 12.9% | 4.0% |
Similar Demographics by Divorced or Separated
Demographics Similar to Russians by Divorced or Separated
In terms of divorced or separated, the demographic groups most similar to Russians are Immigrants from Switzerland (11.5%, a difference of 0.010%), Guyanese (11.5%, a difference of 0.030%), Afghan (11.5%, a difference of 0.070%), Immigrants from Romania (11.5%, a difference of 0.080%), and Immigrants from Bulgaria (11.5%, a difference of 0.11%).
| Demographics | Rating | Rank | Divorced or Separated |
| Taiwanese | 99.6 /100 | #74 | Exceptional 11.5% |
| Immigrants | Northern Africa | 99.6 /100 | #75 | Exceptional 11.5% |
| Albanians | 99.6 /100 | #76 | Exceptional 11.5% |
| Immigrants | Italy | 99.5 /100 | #77 | Exceptional 11.5% |
| Afghans | 99.4 /100 | #78 | Exceptional 11.5% |
| Guyanese | 99.4 /100 | #79 | Exceptional 11.5% |
| Immigrants | Switzerland | 99.4 /100 | #80 | Exceptional 11.5% |
| Russians | 99.4 /100 | #81 | Exceptional 11.5% |
| Immigrants | Romania | 99.3 /100 | #82 | Exceptional 11.5% |
| Immigrants | Bulgaria | 99.3 /100 | #83 | Exceptional 11.5% |
| Bulgarians | 99.3 /100 | #84 | Exceptional 11.5% |
| Immigrants | Albania | 99.3 /100 | #85 | Exceptional 11.5% |
| Immigrants | Latvia | 99.2 /100 | #86 | Exceptional 11.6% |
| Immigrants | Nepal | 99.2 /100 | #87 | Exceptional 11.6% |
| Immigrants | Europe | 99.2 /100 | #88 | Exceptional 11.6% |
Demographics Similar to Nicaraguans by Divorced or Separated
In terms of divorced or separated, the demographic groups most similar to Nicaraguans are Native/Alaskan (13.0%, a difference of 0.050%), Venezuelan (13.0%, a difference of 0.12%), Immigrants from Jamaica (13.0%, a difference of 0.16%), Celtic (13.0%, a difference of 0.41%), and Apache (12.9%, a difference of 0.54%).
| Demographics | Rating | Rank | Divorced or Separated |
| Iroquois | 0.0 /100 | #289 | Tragic 12.9% |
| Pima | 0.0 /100 | #290 | Tragic 12.9% |
| Immigrants | Honduras | 0.0 /100 | #291 | Tragic 12.9% |
| Scotch-Irish | 0.0 /100 | #292 | Tragic 12.9% |
| Jamaicans | 0.0 /100 | #293 | Tragic 12.9% |
| Apache | 0.0 /100 | #294 | Tragic 12.9% |
| Celtics | 0.0 /100 | #295 | Tragic 13.0% |
| Nicaraguans | 0.0 /100 | #296 | Tragic 13.0% |
| Natives/Alaskans | 0.0 /100 | #297 | Tragic 13.0% |
| Venezuelans | 0.0 /100 | #298 | Tragic 13.0% |
| Immigrants | Jamaica | 0.0 /100 | #299 | Tragic 13.0% |
| Immigrants | Cabo Verde | 0.0 /100 | #300 | Tragic 13.1% |
| Alaskan Athabascans | 0.0 /100 | #301 | Tragic 13.1% |
| Immigrants | Venezuela | 0.0 /100 | #302 | Tragic 13.1% |
| Cape Verdeans | 0.0 /100 | #303 | Tragic 13.1% |