Korean vs Belgian Single Mother Households
COMPARE
Korean
Belgian
Single Mother Households
Single Mother Households Comparison
Koreans
Belgians
6.0%
SINGLE MOTHER HOUSEHOLDS
84.4/ 100
METRIC RATING
144th/ 347
METRIC RANK
5.8%
SINGLE MOTHER HOUSEHOLDS
93.5/ 100
METRIC RATING
122nd/ 347
METRIC RANK
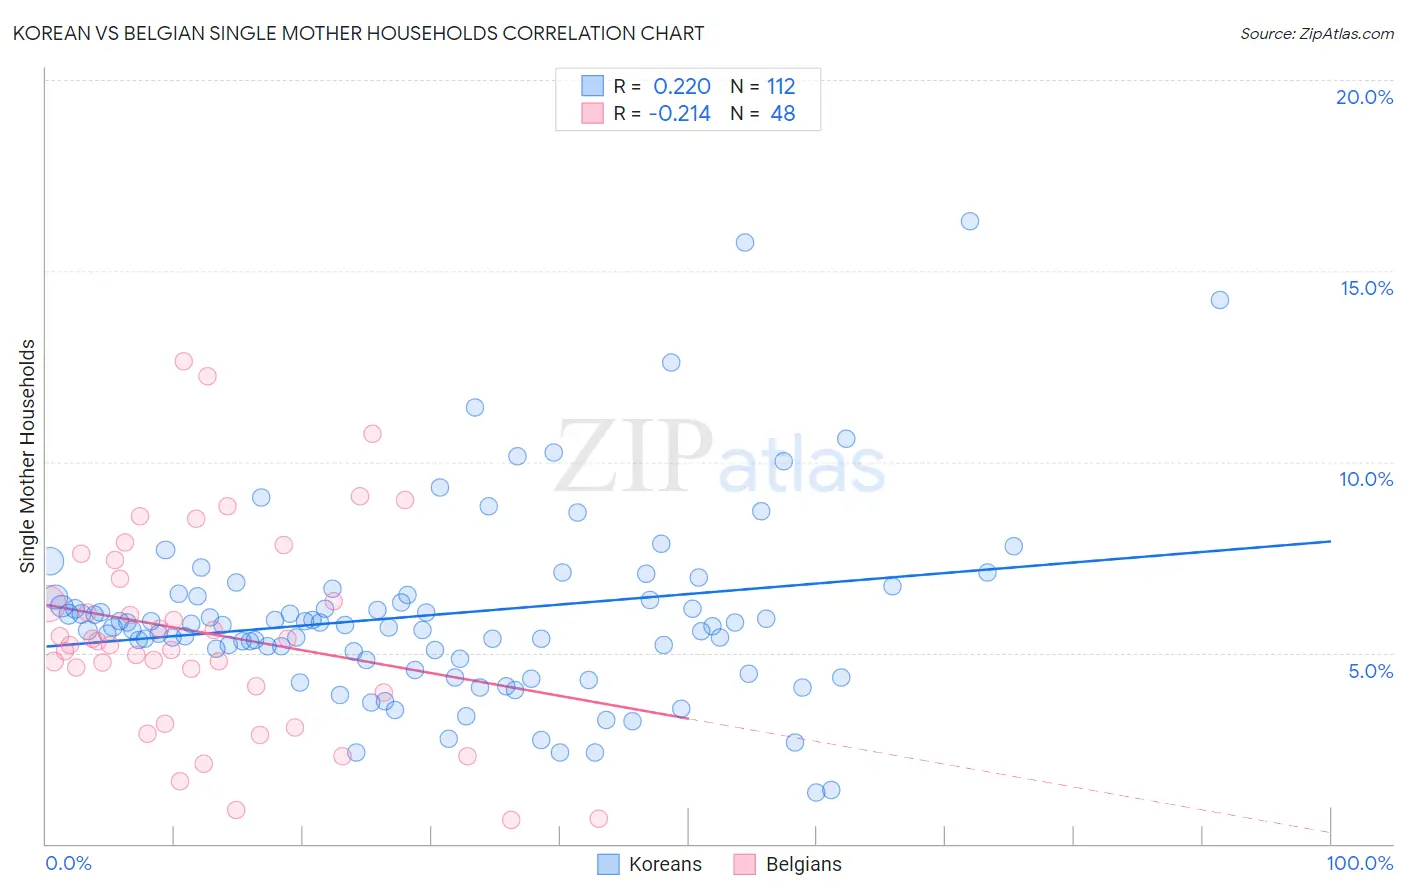
Korean vs Belgian Single Mother Households Correlation Chart
The statistical analysis conducted on geographies consisting of 508,458,058 people shows a weak positive correlation between the proportion of Koreans and percentage of single mother households in the United States with a correlation coefficient (R) of 0.220 and weighted average of 6.0%. Similarly, the statistical analysis conducted on geographies consisting of 354,851,895 people shows a weak negative correlation between the proportion of Belgians and percentage of single mother households in the United States with a correlation coefficient (R) of -0.214 and weighted average of 5.8%, a difference of 2.9%.
Single Mother Households Correlation Summary
| Measurement | Korean | Belgian |
| Minimum | 1.4% | 0.64% |
| Maximum | 16.3% | 12.7% |
| Range | 14.9% | 12.0% |
| Mean | 6.0% | 5.5% |
| Median | 5.7% | 5.3% |
| Interquartile 25% (IQ1) | 4.8% | 4.0% |
| Interquartile 75% (IQ3) | 6.5% | 7.2% |
| Interquartile Range (IQR) | 1.7% | 3.2% |
| Standard Deviation (Sample) | 2.5% | 2.7% |
| Standard Deviation (Population) | 2.5% | 2.7% |
Similar Demographics by Single Mother Households
Demographics Similar to Koreans by Single Mother Households
In terms of single mother households, the demographic groups most similar to Koreans are Arab (6.0%, a difference of 0.090%), Immigrants from Iraq (6.0%, a difference of 0.10%), Immigrants from Egypt (6.0%, a difference of 0.14%), Tsimshian (6.0%, a difference of 0.19%), and French (6.0%, a difference of 0.29%).
| Demographics | Rating | Rank | Single Mother Households |
| Immigrants | Pakistan | 88.4 /100 | #137 | Excellent 6.0% |
| Icelanders | 86.9 /100 | #138 | Excellent 6.0% |
| Syrians | 86.0 /100 | #139 | Excellent 6.0% |
| French | 85.7 /100 | #140 | Excellent 6.0% |
| Tsimshian | 85.2 /100 | #141 | Excellent 6.0% |
| Immigrants | Egypt | 85.0 /100 | #142 | Excellent 6.0% |
| Immigrants | Iraq | 84.8 /100 | #143 | Excellent 6.0% |
| Koreans | 84.4 /100 | #144 | Excellent 6.0% |
| Arabs | 84.0 /100 | #145 | Excellent 6.0% |
| French Canadians | 82.6 /100 | #146 | Excellent 6.0% |
| Immigrants | Jordan | 82.3 /100 | #147 | Excellent 6.0% |
| Scotch-Irish | 82.0 /100 | #148 | Excellent 6.0% |
| Immigrants | Albania | 81.5 /100 | #149 | Excellent 6.1% |
| Zimbabweans | 80.7 /100 | #150 | Excellent 6.1% |
| Immigrants | Southern Europe | 80.5 /100 | #151 | Excellent 6.1% |
Demographics Similar to Belgians by Single Mother Households
In terms of single mother households, the demographic groups most similar to Belgians are Immigrants from Uzbekistan (5.9%, a difference of 0.060%), Argentinean (5.8%, a difference of 0.080%), Tongan (5.8%, a difference of 0.10%), Immigrants from Argentina (5.9%, a difference of 0.13%), and Slavic (5.9%, a difference of 0.29%).
| Demographics | Rating | Rank | Single Mother Households |
| Irish | 94.8 /100 | #115 | Exceptional 5.8% |
| Pennsylvania Germans | 94.7 /100 | #116 | Exceptional 5.8% |
| Bolivians | 94.6 /100 | #117 | Exceptional 5.8% |
| Laotians | 94.3 /100 | #118 | Exceptional 5.8% |
| South Africans | 94.1 /100 | #119 | Exceptional 5.8% |
| Tongans | 93.7 /100 | #120 | Exceptional 5.8% |
| Argentineans | 93.7 /100 | #121 | Exceptional 5.8% |
| Belgians | 93.5 /100 | #122 | Exceptional 5.8% |
| Immigrants | Uzbekistan | 93.4 /100 | #123 | Exceptional 5.9% |
| Immigrants | Argentina | 93.2 /100 | #124 | Exceptional 5.9% |
| Slavs | 92.9 /100 | #125 | Exceptional 5.9% |
| Welsh | 92.8 /100 | #126 | Exceptional 5.9% |
| Lebanese | 92.4 /100 | #127 | Exceptional 5.9% |
| Czechoslovakians | 92.2 /100 | #128 | Exceptional 5.9% |
| Immigrants | Bolivia | 92.2 /100 | #129 | Exceptional 5.9% |