Korean vs Bermudan In Labor Force | Age 20-24
COMPARE
Korean
Bermudan
In Labor Force | Age 20-24
In Labor Force | Age 20-24 Comparison
Koreans
Bermudans
75.4%
IN LABOR FORCE | AGE 20-24
79.7/ 100
METRIC RATING
145th/ 347
METRIC RANK
74.1%
IN LABOR FORCE | AGE 20-24
3.2/ 100
METRIC RATING
237th/ 347
METRIC RANK
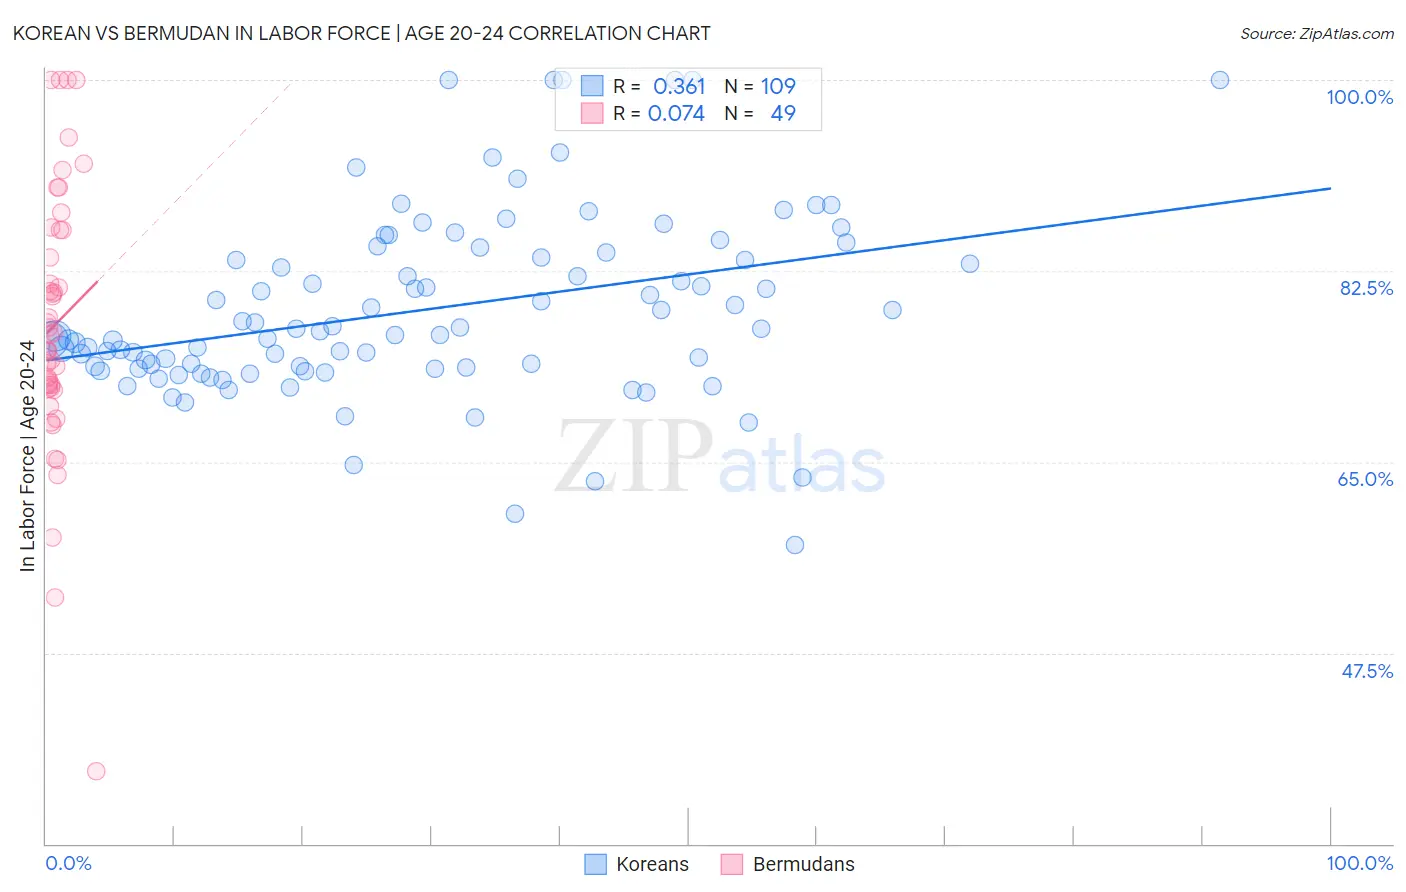
Korean vs Bermudan In Labor Force | Age 20-24 Correlation Chart
The statistical analysis conducted on geographies consisting of 510,540,688 people shows a mild positive correlation between the proportion of Koreans and labor force participation rate among population between the ages 20 and 24 in the United States with a correlation coefficient (R) of 0.361 and weighted average of 75.4%. Similarly, the statistical analysis conducted on geographies consisting of 55,728,431 people shows a slight positive correlation between the proportion of Bermudans and labor force participation rate among population between the ages 20 and 24 in the United States with a correlation coefficient (R) of 0.074 and weighted average of 74.1%, a difference of 1.8%.
In Labor Force | Age 20-24 Correlation Summary
| Measurement | Korean | Bermudan |
| Minimum | 57.4% | 36.7% |
| Maximum | 100.0% | 100.0% |
| Range | 42.6% | 63.3% |
| Mean | 79.0% | 77.6% |
| Median | 76.9% | 76.7% |
| Interquartile 25% (IQ1) | 73.6% | 71.8% |
| Interquartile 75% (IQ3) | 84.0% | 86.2% |
| Interquartile Range (IQR) | 10.3% | 14.4% |
| Standard Deviation (Sample) | 8.4% | 12.3% |
| Standard Deviation (Population) | 8.3% | 12.1% |
Similar Demographics by In Labor Force | Age 20-24
Demographics Similar to Koreans by In Labor Force | Age 20-24
In terms of in labor force | age 20-24, the demographic groups most similar to Koreans are Mexican American Indian (75.4%, a difference of 0.020%), Bhutanese (75.4%, a difference of 0.030%), Spaniard (75.5%, a difference of 0.050%), Comanche (75.4%, a difference of 0.050%), and Immigrants from Cambodia (75.4%, a difference of 0.060%).
| Demographics | Rating | Rank | In Labor Force | Age 20-24 |
| Australians | 84.8 /100 | #138 | Excellent 75.5% |
| Immigrants | England | 84.6 /100 | #139 | Excellent 75.5% |
| Delaware | 84.5 /100 | #140 | Excellent 75.5% |
| Romanians | 84.1 /100 | #141 | Excellent 75.5% |
| Blackfeet | 83.6 /100 | #142 | Excellent 75.5% |
| Spaniards | 82.0 /100 | #143 | Excellent 75.5% |
| Bhutanese | 80.8 /100 | #144 | Excellent 75.4% |
| Koreans | 79.7 /100 | #145 | Good 75.4% |
| Mexican American Indians | 78.8 /100 | #146 | Good 75.4% |
| Comanche | 77.6 /100 | #147 | Good 75.4% |
| Immigrants | Cambodia | 76.7 /100 | #148 | Good 75.4% |
| Ugandans | 76.1 /100 | #149 | Good 75.4% |
| Salvadorans | 74.8 /100 | #150 | Good 75.3% |
| Paiute | 74.1 /100 | #151 | Good 75.3% |
| Lebanese | 73.5 /100 | #152 | Good 75.3% |
Demographics Similar to Bermudans by In Labor Force | Age 20-24
In terms of in labor force | age 20-24, the demographic groups most similar to Bermudans are Immigrants from France (74.1%, a difference of 0.010%), Laotian (74.1%, a difference of 0.030%), Immigrants from Japan (74.1%, a difference of 0.030%), Immigrants (74.1%, a difference of 0.040%), and Immigrants from Chile (74.1%, a difference of 0.050%).
| Demographics | Rating | Rank | In Labor Force | Age 20-24 |
| Immigrants | Albania | 4.3 /100 | #230 | Tragic 74.2% |
| Immigrants | Greece | 4.1 /100 | #231 | Tragic 74.2% |
| Immigrants | Switzerland | 4.1 /100 | #232 | Tragic 74.2% |
| Immigrants | Chile | 3.7 /100 | #233 | Tragic 74.1% |
| Immigrants | Immigrants | 3.6 /100 | #234 | Tragic 74.1% |
| Laotians | 3.5 /100 | #235 | Tragic 74.1% |
| Immigrants | France | 3.3 /100 | #236 | Tragic 74.1% |
| Bermudans | 3.2 /100 | #237 | Tragic 74.1% |
| Immigrants | Japan | 3.0 /100 | #238 | Tragic 74.1% |
| Immigrants | Latin America | 2.7 /100 | #239 | Tragic 74.1% |
| Immigrants | Sri Lanka | 2.3 /100 | #240 | Tragic 74.0% |
| Immigrants | Senegal | 2.1 /100 | #241 | Tragic 74.0% |
| Thais | 2.1 /100 | #242 | Tragic 74.0% |
| Immigrants | Syria | 1.9 /100 | #243 | Tragic 74.0% |
| Immigrants | South Central Asia | 1.9 /100 | #244 | Tragic 74.0% |