Korean vs Ghanaian Single Mother Households
COMPARE
Korean
Ghanaian
Single Mother Households
Single Mother Households Comparison
Koreans
Ghanaians
6.0%
SINGLE MOTHER HOUSEHOLDS
84.4/ 100
METRIC RATING
144th/ 347
METRIC RANK
7.8%
SINGLE MOTHER HOUSEHOLDS
0.0/ 100
METRIC RATING
292nd/ 347
METRIC RANK
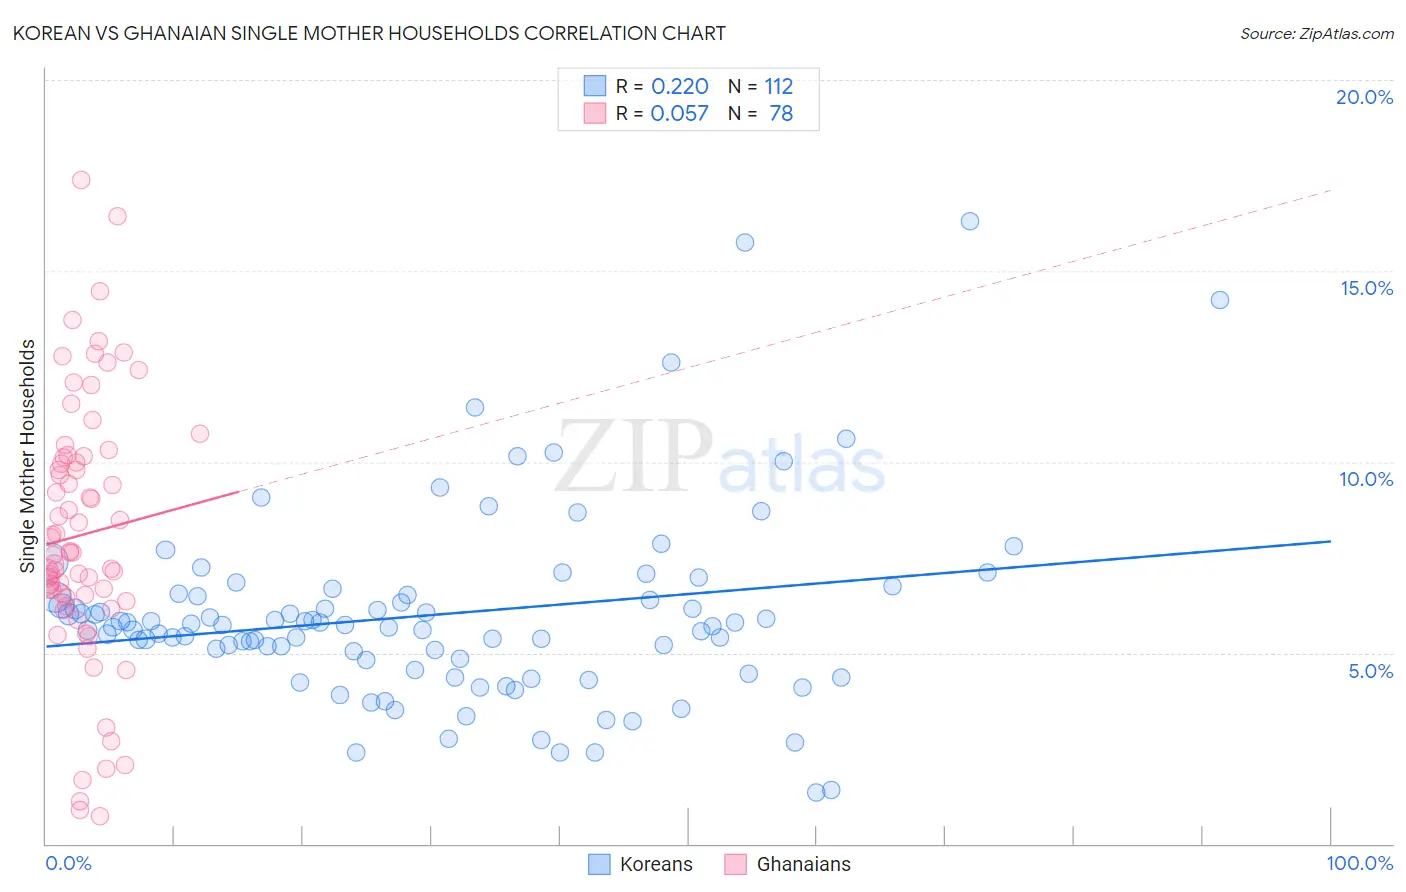
Korean vs Ghanaian Single Mother Households Correlation Chart
The statistical analysis conducted on geographies consisting of 508,458,058 people shows a weak positive correlation between the proportion of Koreans and percentage of single mother households in the United States with a correlation coefficient (R) of 0.220 and weighted average of 6.0%. Similarly, the statistical analysis conducted on geographies consisting of 190,389,453 people shows a slight positive correlation between the proportion of Ghanaians and percentage of single mother households in the United States with a correlation coefficient (R) of 0.057 and weighted average of 7.8%, a difference of 30.3%.
Single Mother Households Correlation Summary
| Measurement | Korean | Ghanaian |
| Minimum | 1.4% | 0.73% |
| Maximum | 16.3% | 17.4% |
| Range | 14.9% | 16.6% |
| Mean | 6.0% | 8.1% |
| Median | 5.7% | 7.6% |
| Interquartile 25% (IQ1) | 4.8% | 6.4% |
| Interquartile 75% (IQ3) | 6.5% | 10.1% |
| Interquartile Range (IQR) | 1.7% | 3.7% |
| Standard Deviation (Sample) | 2.5% | 3.4% |
| Standard Deviation (Population) | 2.5% | 3.4% |
Similar Demographics by Single Mother Households
Demographics Similar to Koreans by Single Mother Households
In terms of single mother households, the demographic groups most similar to Koreans are Arab (6.0%, a difference of 0.090%), Immigrants from Iraq (6.0%, a difference of 0.10%), Immigrants from Egypt (6.0%, a difference of 0.14%), Tsimshian (6.0%, a difference of 0.19%), and French (6.0%, a difference of 0.29%).
| Demographics | Rating | Rank | Single Mother Households |
| Immigrants | Pakistan | 88.4 /100 | #137 | Excellent 6.0% |
| Icelanders | 86.9 /100 | #138 | Excellent 6.0% |
| Syrians | 86.0 /100 | #139 | Excellent 6.0% |
| French | 85.7 /100 | #140 | Excellent 6.0% |
| Tsimshian | 85.2 /100 | #141 | Excellent 6.0% |
| Immigrants | Egypt | 85.0 /100 | #142 | Excellent 6.0% |
| Immigrants | Iraq | 84.8 /100 | #143 | Excellent 6.0% |
| Koreans | 84.4 /100 | #144 | Excellent 6.0% |
| Arabs | 84.0 /100 | #145 | Excellent 6.0% |
| French Canadians | 82.6 /100 | #146 | Excellent 6.0% |
| Immigrants | Jordan | 82.3 /100 | #147 | Excellent 6.0% |
| Scotch-Irish | 82.0 /100 | #148 | Excellent 6.0% |
| Immigrants | Albania | 81.5 /100 | #149 | Excellent 6.1% |
| Zimbabweans | 80.7 /100 | #150 | Excellent 6.1% |
| Immigrants | Southern Europe | 80.5 /100 | #151 | Excellent 6.1% |
Demographics Similar to Ghanaians by Single Mother Households
In terms of single mother households, the demographic groups most similar to Ghanaians are West Indian (7.8%, a difference of 0.010%), Immigrants from Nigeria (7.8%, a difference of 0.090%), Immigrants from Cameroon (7.9%, a difference of 0.36%), Apache (7.9%, a difference of 0.46%), and Subsaharan African (7.8%, a difference of 0.51%).
| Demographics | Rating | Rank | Single Mother Households |
| Trinidadians and Tobagonians | 0.0 /100 | #285 | Tragic 7.7% |
| Immigrants | Middle Africa | 0.0 /100 | #286 | Tragic 7.7% |
| Immigrants | Guatemala | 0.0 /100 | #287 | Tragic 7.7% |
| Sierra Leoneans | 0.0 /100 | #288 | Tragic 7.7% |
| Sub-Saharan Africans | 0.0 /100 | #289 | Tragic 7.8% |
| Immigrants | Nigeria | 0.0 /100 | #290 | Tragic 7.8% |
| West Indians | 0.0 /100 | #291 | Tragic 7.8% |
| Ghanaians | 0.0 /100 | #292 | Tragic 7.8% |
| Immigrants | Cameroon | 0.0 /100 | #293 | Tragic 7.9% |
| Apache | 0.0 /100 | #294 | Tragic 7.9% |
| Barbadians | 0.0 /100 | #295 | Tragic 7.9% |
| Immigrants | Latin America | 0.0 /100 | #296 | Tragic 7.9% |
| Hispanics or Latinos | 0.0 /100 | #297 | Tragic 7.9% |
| Immigrants | West Indies | 0.0 /100 | #298 | Tragic 7.9% |
| Houma | 0.0 /100 | #299 | Tragic 7.9% |