Korean vs Immigrants from Eastern Africa Single Mother Households
COMPARE
Korean
Immigrants from Eastern Africa
Single Mother Households
Single Mother Households Comparison
Koreans
Immigrants from Eastern Africa
6.0%
SINGLE MOTHER HOUSEHOLDS
84.4/ 100
METRIC RATING
144th/ 347
METRIC RANK
6.8%
SINGLE MOTHER HOUSEHOLDS
4.4/ 100
METRIC RATING
218th/ 347
METRIC RANK
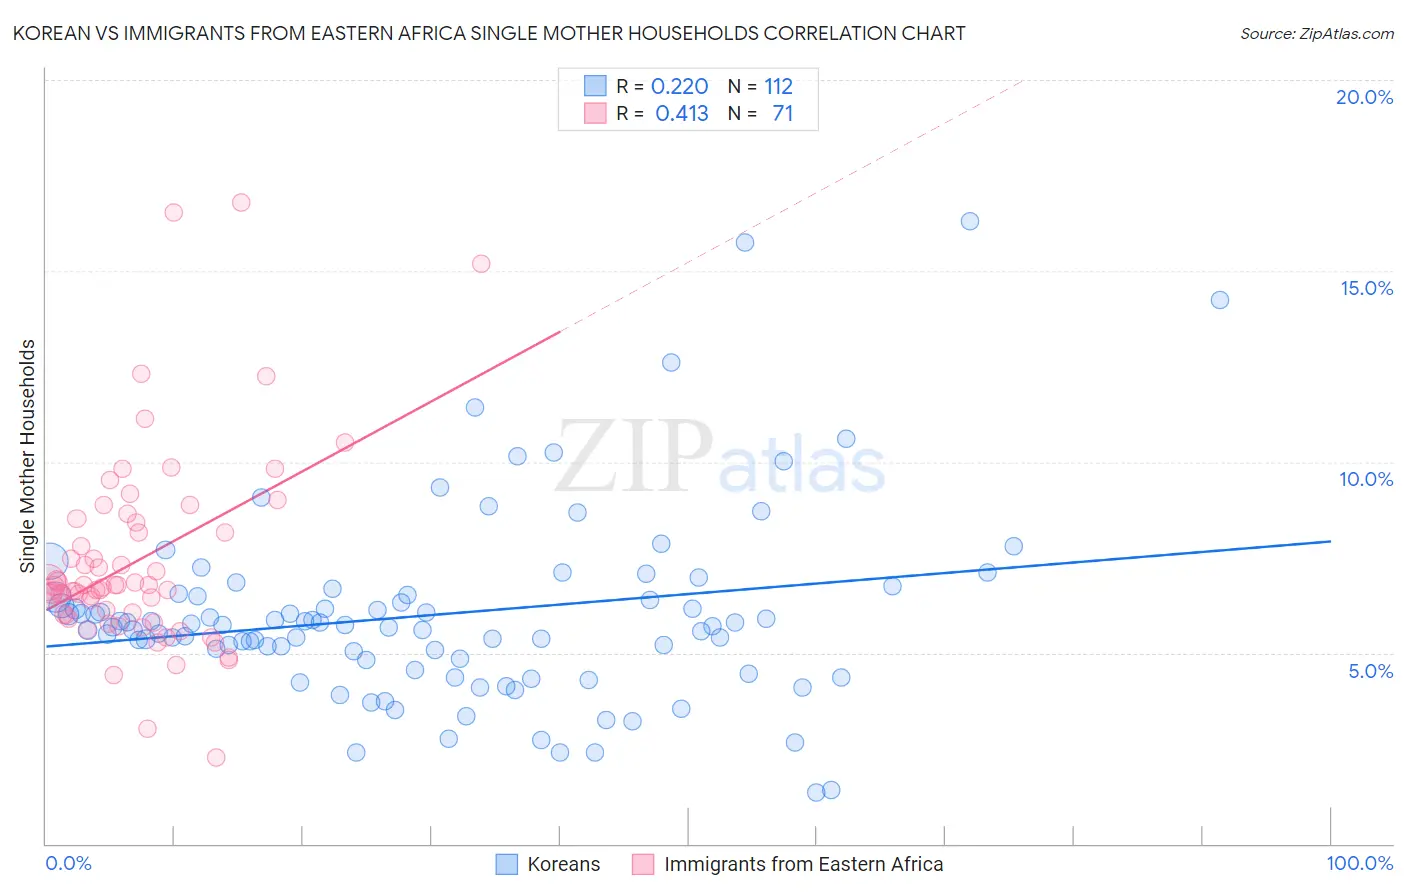
Korean vs Immigrants from Eastern Africa Single Mother Households Correlation Chart
The statistical analysis conducted on geographies consisting of 508,458,058 people shows a weak positive correlation between the proportion of Koreans and percentage of single mother households in the United States with a correlation coefficient (R) of 0.220 and weighted average of 6.0%. Similarly, the statistical analysis conducted on geographies consisting of 354,507,775 people shows a moderate positive correlation between the proportion of Immigrants from Eastern Africa and percentage of single mother households in the United States with a correlation coefficient (R) of 0.413 and weighted average of 6.8%, a difference of 13.6%.
Single Mother Households Correlation Summary
| Measurement | Korean | Immigrants from Eastern Africa |
| Minimum | 1.4% | 2.3% |
| Maximum | 16.3% | 16.8% |
| Range | 14.9% | 14.5% |
| Mean | 6.0% | 7.4% |
| Median | 5.7% | 6.8% |
| Interquartile 25% (IQ1) | 4.8% | 6.0% |
| Interquartile 75% (IQ3) | 6.5% | 8.4% |
| Interquartile Range (IQR) | 1.7% | 2.4% |
| Standard Deviation (Sample) | 2.5% | 2.6% |
| Standard Deviation (Population) | 2.5% | 2.6% |
Similar Demographics by Single Mother Households
Demographics Similar to Koreans by Single Mother Households
In terms of single mother households, the demographic groups most similar to Koreans are Arab (6.0%, a difference of 0.090%), Immigrants from Iraq (6.0%, a difference of 0.10%), Immigrants from Egypt (6.0%, a difference of 0.14%), Tsimshian (6.0%, a difference of 0.19%), and French (6.0%, a difference of 0.29%).
| Demographics | Rating | Rank | Single Mother Households |
| Immigrants | Pakistan | 88.4 /100 | #137 | Excellent 6.0% |
| Icelanders | 86.9 /100 | #138 | Excellent 6.0% |
| Syrians | 86.0 /100 | #139 | Excellent 6.0% |
| French | 85.7 /100 | #140 | Excellent 6.0% |
| Tsimshian | 85.2 /100 | #141 | Excellent 6.0% |
| Immigrants | Egypt | 85.0 /100 | #142 | Excellent 6.0% |
| Immigrants | Iraq | 84.8 /100 | #143 | Excellent 6.0% |
| Koreans | 84.4 /100 | #144 | Excellent 6.0% |
| Arabs | 84.0 /100 | #145 | Excellent 6.0% |
| French Canadians | 82.6 /100 | #146 | Excellent 6.0% |
| Immigrants | Jordan | 82.3 /100 | #147 | Excellent 6.0% |
| Scotch-Irish | 82.0 /100 | #148 | Excellent 6.0% |
| Immigrants | Albania | 81.5 /100 | #149 | Excellent 6.1% |
| Zimbabweans | 80.7 /100 | #150 | Excellent 6.1% |
| Immigrants | Southern Europe | 80.5 /100 | #151 | Excellent 6.1% |
Demographics Similar to Immigrants from Eastern Africa by Single Mother Households
In terms of single mother households, the demographic groups most similar to Immigrants from Eastern Africa are Immigrants (6.8%, a difference of 0.090%), Aleut (6.8%, a difference of 0.21%), Immigrants from Thailand (6.9%, a difference of 0.27%), Cherokee (6.8%, a difference of 0.36%), and French American Indian (6.9%, a difference of 0.47%).
| Demographics | Rating | Rank | Single Mother Households |
| Immigrants | Venezuela | 8.5 /100 | #211 | Tragic 6.7% |
| Immigrants | Eritrea | 8.4 /100 | #212 | Tragic 6.7% |
| Immigrants | Costa Rica | 8.2 /100 | #213 | Tragic 6.7% |
| Immigrants | Uruguay | 7.9 /100 | #214 | Tragic 6.7% |
| Shoshone | 5.7 /100 | #215 | Tragic 6.8% |
| Cherokee | 5.1 /100 | #216 | Tragic 6.8% |
| Aleuts | 4.8 /100 | #217 | Tragic 6.8% |
| Immigrants | Eastern Africa | 4.4 /100 | #218 | Tragic 6.8% |
| Immigrants | Immigrants | 4.3 /100 | #219 | Tragic 6.8% |
| Immigrants | Thailand | 4.0 /100 | #220 | Tragic 6.9% |
| French American Indians | 3.7 /100 | #221 | Tragic 6.9% |
| Immigrants | Bangladesh | 3.7 /100 | #222 | Tragic 6.9% |
| Immigrants | Micronesia | 3.6 /100 | #223 | Tragic 6.9% |
| Immigrants | Sudan | 3.5 /100 | #224 | Tragic 6.9% |
| Sudanese | 3.1 /100 | #225 | Tragic 6.9% |