Kenyan vs Lebanese Births to Unmarried Women
COMPARE
Kenyan
Lebanese
Births to Unmarried Women
Births to Unmarried Women Comparison
Kenyans
Lebanese
31.9%
BIRTHS TO UNMARRIED WOMEN
43.0/ 100
METRIC RATING
182nd/ 347
METRIC RANK
29.5%
BIRTHS TO UNMARRIED WOMEN
94.4/ 100
METRIC RATING
103rd/ 347
METRIC RANK
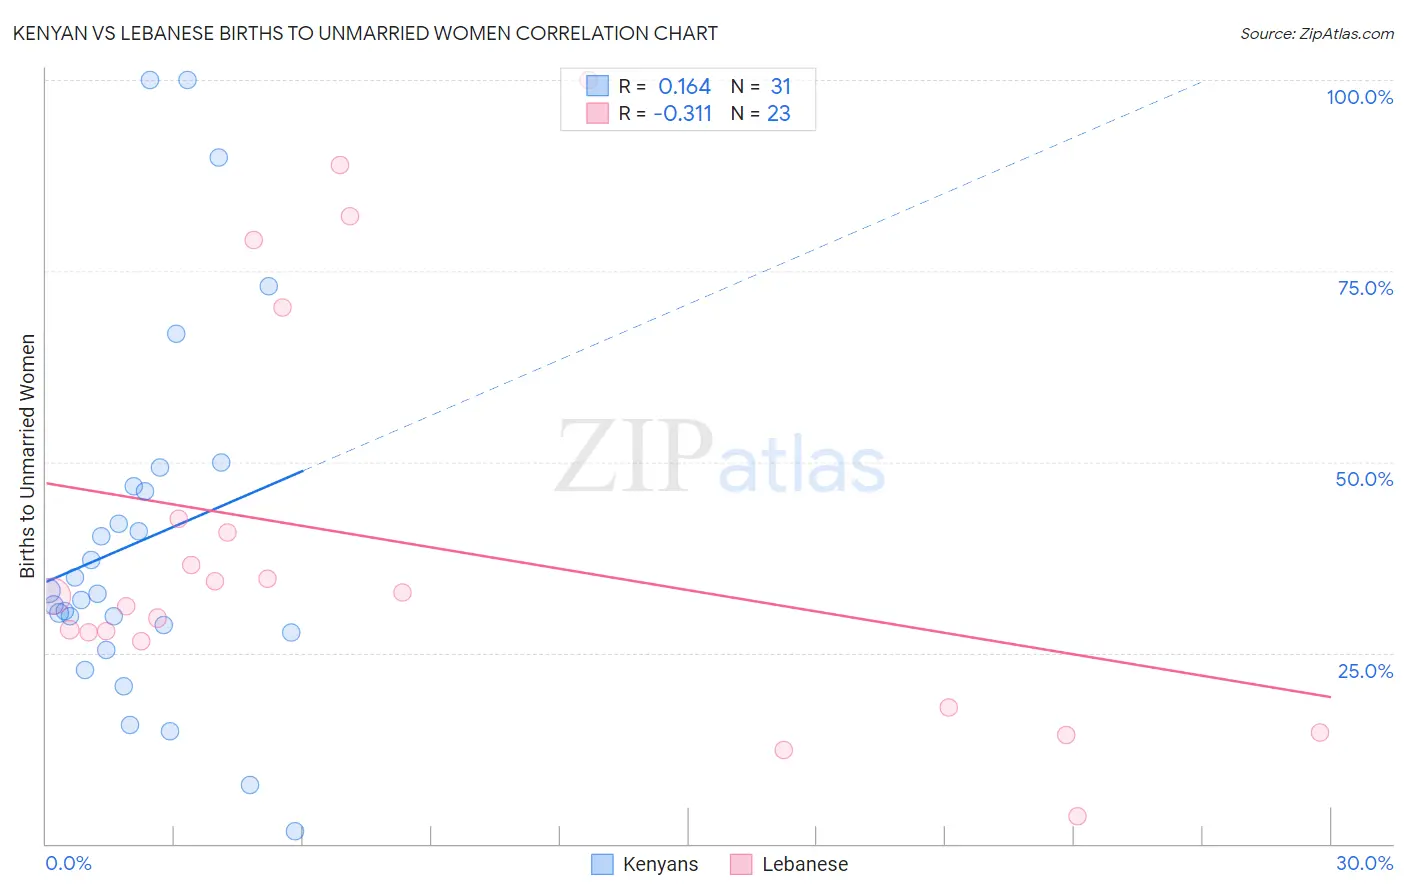
Kenyan vs Lebanese Births to Unmarried Women Correlation Chart
The statistical analysis conducted on geographies consisting of 163,852,803 people shows a poor positive correlation between the proportion of Kenyans and percentage of births to unmarried women in the United States with a correlation coefficient (R) of 0.164 and weighted average of 31.9%. Similarly, the statistical analysis conducted on geographies consisting of 372,610,698 people shows a mild negative correlation between the proportion of Lebanese and percentage of births to unmarried women in the United States with a correlation coefficient (R) of -0.311 and weighted average of 29.5%, a difference of 7.9%.
Births to Unmarried Women Correlation Summary
| Measurement | Kenyan | Lebanese |
| Minimum | 1.6% | 3.6% |
| Maximum | 100.0% | 100.0% |
| Range | 98.4% | 96.4% |
| Mean | 39.7% | 39.5% |
| Median | 32.7% | 32.4% |
| Interquartile 25% (IQ1) | 27.6% | 26.4% |
| Interquartile 75% (IQ3) | 46.9% | 42.6% |
| Interquartile Range (IQR) | 19.3% | 16.2% |
| Standard Deviation (Sample) | 24.0% | 26.2% |
| Standard Deviation (Population) | 23.7% | 25.6% |
Similar Demographics by Births to Unmarried Women
Demographics Similar to Kenyans by Births to Unmarried Women
In terms of births to unmarried women, the demographic groups most similar to Kenyans are Canadian (31.9%, a difference of 0.16%), Immigrants from Peru (31.8%, a difference of 0.20%), Immigrants from South America (32.0%, a difference of 0.23%), Moroccan (31.8%, a difference of 0.26%), and German (32.0%, a difference of 0.34%).
| Demographics | Rating | Rank | Births to Unmarried Women |
| Immigrants | Venezuela | 49.2 /100 | #175 | Average 31.7% |
| Scottish | 48.1 /100 | #176 | Average 31.7% |
| South American Indians | 47.7 /100 | #177 | Average 31.7% |
| English | 47.4 /100 | #178 | Average 31.7% |
| South Americans | 46.9 /100 | #179 | Average 31.8% |
| Moroccans | 45.7 /100 | #180 | Average 31.8% |
| Immigrants | Peru | 45.1 /100 | #181 | Average 31.8% |
| Kenyans | 43.0 /100 | #182 | Average 31.9% |
| Canadians | 41.4 /100 | #183 | Average 31.9% |
| Immigrants | South America | 40.7 /100 | #184 | Average 32.0% |
| Germans | 39.5 /100 | #185 | Fair 32.0% |
| Welsh | 38.2 /100 | #186 | Fair 32.0% |
| Czechoslovakians | 38.0 /100 | #187 | Fair 32.0% |
| Osage | 37.1 /100 | #188 | Fair 32.1% |
| Immigrants | Kenya | 36.9 /100 | #189 | Fair 32.1% |
Demographics Similar to Lebanese by Births to Unmarried Women
In terms of births to unmarried women, the demographic groups most similar to Lebanese are Lithuanian (29.6%, a difference of 0.010%), Australian (29.5%, a difference of 0.050%), Immigrants from Nepal (29.6%, a difference of 0.060%), Immigrants from Northern Africa (29.5%, a difference of 0.13%), and Swedish (29.6%, a difference of 0.32%).
| Demographics | Rating | Rank | Births to Unmarried Women |
| Norwegians | 95.8 /100 | #96 | Exceptional 29.3% |
| Immigrants | South Africa | 95.7 /100 | #97 | Exceptional 29.3% |
| Immigrants | Syria | 95.7 /100 | #98 | Exceptional 29.4% |
| Immigrants | Denmark | 95.3 /100 | #99 | Exceptional 29.4% |
| Luxembourgers | 95.2 /100 | #100 | Exceptional 29.4% |
| Immigrants | Northern Africa | 94.7 /100 | #101 | Exceptional 29.5% |
| Australians | 94.6 /100 | #102 | Exceptional 29.5% |
| Lebanese | 94.4 /100 | #103 | Exceptional 29.5% |
| Lithuanians | 94.4 /100 | #104 | Exceptional 29.6% |
| Immigrants | Nepal | 94.3 /100 | #105 | Exceptional 29.6% |
| Swedes | 93.8 /100 | #106 | Exceptional 29.6% |
| Immigrants | Brazil | 93.7 /100 | #107 | Exceptional 29.6% |
| Paraguayans | 93.5 /100 | #108 | Exceptional 29.7% |
| Greeks | 93.4 /100 | #109 | Exceptional 29.7% |
| Immigrants | Ethiopia | 93.4 /100 | #110 | Exceptional 29.7% |