Jordanian vs Afghan Single Father Households
COMPARE
Jordanian
Afghan
Single Father Households
Single Father Households Comparison
Jordanians
Afghans
2.2%
SINGLE FATHER HOUSEHOLDS
96.9/ 100
METRIC RATING
127th/ 347
METRIC RANK
2.3%
SINGLE FATHER HOUSEHOLDS
50.0/ 100
METRIC RATING
174th/ 347
METRIC RANK
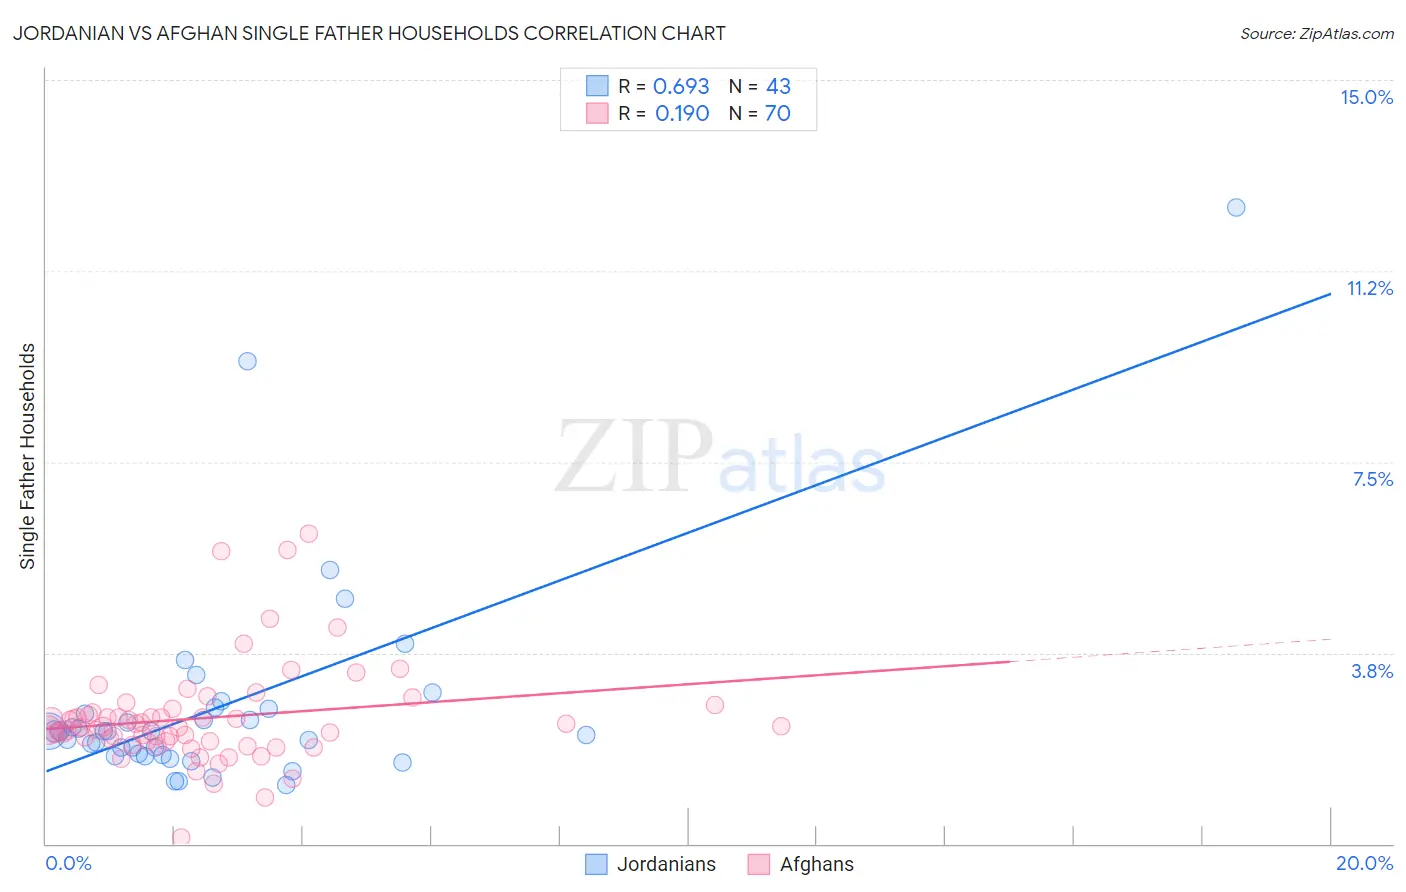
Jordanian vs Afghan Single Father Households Correlation Chart
The statistical analysis conducted on geographies consisting of 165,930,664 people shows a significant positive correlation between the proportion of Jordanians and percentage of single father households in the United States with a correlation coefficient (R) of 0.693 and weighted average of 2.2%. Similarly, the statistical analysis conducted on geographies consisting of 148,375,080 people shows a poor positive correlation between the proportion of Afghans and percentage of single father households in the United States with a correlation coefficient (R) of 0.190 and weighted average of 2.3%, a difference of 6.8%.
Single Father Households Correlation Summary
| Measurement | Jordanian | Afghan |
| Minimum | 1.1% | 0.11% |
| Maximum | 12.5% | 6.1% |
| Range | 11.4% | 6.0% |
| Mean | 2.7% | 2.5% |
| Median | 2.2% | 2.3% |
| Interquartile 25% (IQ1) | 1.7% | 2.0% |
| Interquartile 75% (IQ3) | 2.6% | 2.6% |
| Interquartile Range (IQR) | 0.89% | 0.57% |
| Standard Deviation (Sample) | 2.1% | 0.99% |
| Standard Deviation (Population) | 2.0% | 0.98% |
Similar Demographics by Single Father Households
Demographics Similar to Jordanians by Single Father Households
In terms of single father households, the demographic groups most similar to Jordanians are Moroccan (2.2%, a difference of 0.0%), Immigrants from England (2.2%, a difference of 0.040%), Serbian (2.2%, a difference of 0.050%), Immigrants from Chile (2.2%, a difference of 0.17%), and Immigrants from Jordan (2.2%, a difference of 0.23%).
| Demographics | Rating | Rank | Single Father Households |
| Australians | 97.7 /100 | #120 | Exceptional 2.2% |
| Immigrants | Brazil | 97.7 /100 | #121 | Exceptional 2.2% |
| Immigrants | Iraq | 97.6 /100 | #122 | Exceptional 2.2% |
| Immigrants | Yemen | 97.5 /100 | #123 | Exceptional 2.2% |
| British West Indians | 97.4 /100 | #124 | Exceptional 2.2% |
| Immigrants | Indonesia | 97.4 /100 | #125 | Exceptional 2.2% |
| Moroccans | 96.9 /100 | #126 | Exceptional 2.2% |
| Jordanians | 96.9 /100 | #127 | Exceptional 2.2% |
| Immigrants | England | 96.8 /100 | #128 | Exceptional 2.2% |
| Serbians | 96.8 /100 | #129 | Exceptional 2.2% |
| Immigrants | Chile | 96.7 /100 | #130 | Exceptional 2.2% |
| Immigrants | Jordan | 96.6 /100 | #131 | Exceptional 2.2% |
| Poles | 96.5 /100 | #132 | Exceptional 2.2% |
| Taiwanese | 96.3 /100 | #133 | Exceptional 2.2% |
| Zimbabweans | 95.1 /100 | #134 | Exceptional 2.2% |
Demographics Similar to Afghans by Single Father Households
In terms of single father households, the demographic groups most similar to Afghans are Immigrants from Jamaica (2.3%, a difference of 0.070%), Danish (2.3%, a difference of 0.13%), Colombian (2.3%, a difference of 0.14%), Celtic (2.3%, a difference of 0.40%), and Costa Rican (2.3%, a difference of 0.44%).
| Demographics | Rating | Rank | Single Father Households |
| South Americans | 64.3 /100 | #167 | Good 2.3% |
| Icelanders | 63.1 /100 | #168 | Good 2.3% |
| Czechs | 62.5 /100 | #169 | Good 2.3% |
| Ugandans | 62.2 /100 | #170 | Good 2.3% |
| Swedes | 61.6 /100 | #171 | Good 2.3% |
| Czechoslovakians | 58.9 /100 | #172 | Average 2.3% |
| Celtics | 55.4 /100 | #173 | Average 2.3% |
| Afghans | 50.0 /100 | #174 | Average 2.3% |
| Immigrants | Jamaica | 49.1 /100 | #175 | Average 2.3% |
| Danes | 48.2 /100 | #176 | Average 2.3% |
| Colombians | 48.0 /100 | #177 | Average 2.3% |
| Costa Ricans | 44.1 /100 | #178 | Average 2.3% |
| Welsh | 44.0 /100 | #179 | Average 2.3% |
| Yugoslavians | 43.9 /100 | #180 | Average 2.3% |
| Jamaicans | 43.5 /100 | #181 | Average 2.3% |